

Introduction
Stroke is a major cause of death in developed countries, including the US and Europe [1,2]. In Korea, stroke rates are expected to increase due to the aging of population. According to the mortality data of the Korean Statistical Information Service in 2010, the second leading cause of death by disease group in Korea is cardiovascular diseases, followed cancer. Stroke, which is one of the most common cardiovascular diseases, is currently the number one cause of death attributed to a single organ disease [3]. In addition, according to the Korean National Health and Nutritional Examination Survey (KNHANES), although the stroke mortality rate decreased by 12.1% from 2005 to 2008, the prevalence of stroke in people over the age of 30 increased by 0.4% [4].
In addition, elderly people (those over 65 years old) comprised 10.6% of the Korean population in 2010, and by 2019 that proportion is expected to increase to 14.4%. This demographic transition is likely to become even more significant as life expectancy increases [5]. This supports the theory that stroke will remain one of most important diseases in terms of Korea's overall disease burden.
Stroke is known to contribute to high mortality rates and socioeconomic costs. For example, a British study using a prevalence-based approach estimated the costs associated with stroke at $13 billion, while a one-year study using an incidence-based approach reported that stroke-related costs equaled $65.5 billion in 2008 in the US [1,6]. Previous studies have estimated the cost of stroke in Korea. One study using an incidence-based approach calculated the lifetime cost per person, and found that the cost for a Korean man was expected to be $167,250 with an age of onset of 45 [7]. Another study by Lim et al. estimated the economic burden of stroke in 2005 using a prevalence-based approach [8]. However, this study did not assess the overall costs of stroke. For example, it excluded the cost of assistive devices integral to rehabilitation. Studies conducted in developed countries have typically included the cost of assistive devices in the estimation of overall costs [1,2,8,9]. Because stroke is often accompanied by disabilities that impede the activities of daily living, the costs for rehabilitation, such as assistive devices, should be considered when measuring the economic burden of stroke [1]. For example, in a Canadian study, the cost of assistive devices was 0.3% of the direct medical costs of stroke, which was equal to the cost of prescription drugs and professional fees [10]. A Swedish study that assessed the cost of assistive devices during the first year after acute stroke showed that $646 was spent per patient [11]. In order to manage stroke patients more efficiently, a more accurate estimate of Korean stroke-related costs is needed.
The objective of this study was to estimate the economic burden of stroke during 2010 using data from the National Health Insurance Corporation (NHIC). We also examined the components of stroke-related costs in Korea, using the most up-to-date nationally representative data available.
Methods
In this study, we calculated the cost of stroke using a prevalence-based approach. Stroke was defined as I60-I63 according to the International Classification of Disease 10th version, and stroke cases were classified into two subtypes: hemorrhagic stroke (codes I60-I62) and ischemic stroke (code I63) [12]. To increase the accuracy of the case definitions, stroke patients were defined as those with a primary diagnosis of stroke who had at least one inpatient or three outpatient claims for visiting or hospitalization in a medical institution during 2010 [2]. All costs measured were converted into US dollars using an exchange rate of 1,176 Korean won to US $1 (2010 exchange rate) [13].
The economic costs of stroke were divided into direct and indirect costs. Direct costs were direct medical care costs, including non-NHIC-covered care costs, medical services, costs of meals, and elective services, as well as prescription and assistive device costs. Direct non-medical costs consisted of transportation costs and caregiver costs [1,2,9].
In order to assess direct medical costs, we used claims data from the NHIC in 2010. In Korea, the NHIC is the exclusive health insurer. Thus, the NHIC claims data are representative of medical expenses from the Korean insurance program [14]. Prescription costs were defined as the calculated costs of drugs prescribed to stroke outpatients during 2010 based on NHIC claims data.
In order to assess non-NHIC-covered care costs, data on the proportion of non-NHIC covered cost were gathered. The non-NHIC covered cost rates of stroke patients were applied in our analysis (inpatient: 16.8% for hemorrhagic stroke and 13.9% for ischemic stroke; outpatient stroke: 16.6%) [15].
Additionally, to collect information on assistive devices costs, a survey of 83 patients was conducted at three rehabilitation hospitals by authors (Department of Rehabilitation Medicine, Konkuk University Medical Center, of Yeogang Rehabilitation Center, and of Bucheon Daesung Rehabilitation Hospital). This group was composed of patients in both acute and chronic stages of stroke. The survey determined the annual average cost of assistive devices to be $205.40 per person. This amount was then multiplied by the number of stroke patients.
In order to calculate direct non-medical costs, the average two-way transportation cost per hospital visit was calculated based on data obtained from the Korean Health Panel in 2008 [14]. The average one-way transportation cost per inpatient visit for stroke was $6.83, which covered the transportation costs of the patient and a caregiver. The cost of one-way transportation per outpatient visit was calculated to be $0.70 [16].
For inpatient visits, caregiver costs were calculated by multiplying the number of days of hospitalization by the average caregiver cost per day ($51.00 in 2005). We used the cost established by a representative nursing service provider instead of the value of Korea Health Panel because of small proportion of using the paid care giver in Korea Health Panel [17]. Also to estimate the cost of family or other voluntary caregiver, the average wage of paid caregiver is used as a proxy for the cost of caregiving, because the difference of task in caregiving between paid and unpaid caregiver is unknown [18]. In order to convert the caregiver rate to 2010 prices, the price index of 116 was adjusted, comparing with the price index of 2005. In order to calculate caregiver costs for outpatient visits, it was assumed that patients younger than nine years of age and older than 60 would require a caregiver. The average daily wage for a caregiver in 2005 was multiplied by the total number of outpatient visits and then adjusted to reflect the 2010 price index. It was assumed that each outpatient visit would require approximately 1/3 of the patient's daily working hours [14]. Visit duration was then multiplied by the number of outpatient visits.
Indirect costs were defined as the opportunity costs lost due to the use of medical services or premature death, and were estimated by calculating the total productivity loss based on the human capital approach [19]. Productivity loss for inpatients was determined by calculating the average monthly working hours and the average monthly wage as detailed by a survey report on labor conditions in 2007 [20]. Because patients under 19 and over 70 years of age were not considered to be of working age, only the productivity losses for patients between the ages of 20 and 69 were considered. In order to estimate average monthly work losses due to outpatient visits, the average visit duration was multiplied by the number of outpatient visits.
Productivity loss resulting from premature death was calculated based on the number of deaths from stroke reported in the cause of death statistics [3]. Potential incomes of the age groups were converted into present values by an annual discount rate of 5% [21].
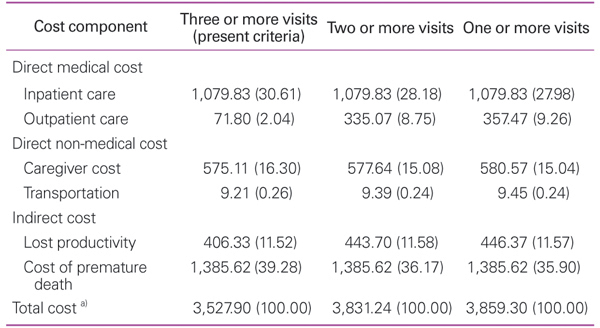
To complete the sensitivity analysis, two methods were employed: varying the discount rates for the cost of mortality and varying outpatient case definitions for stroke. The cost of premature death was recalculated using the annual discount rates of 0% and 3%, instead of 5%. Second, a cost estimation using three different outpatient case definitions, including having one or two outpatient claims and the present criteria, was conducted.
Results
In 2010, the total number of treated cases of stroke was 396,843, the number of cases of ischemic stroke was 332,523, and the number of cases of hemorrhagic stroke was 64,319. There were no significant differences in the number of treated cases according to gender: 203,847 were males and 192,996 were females.
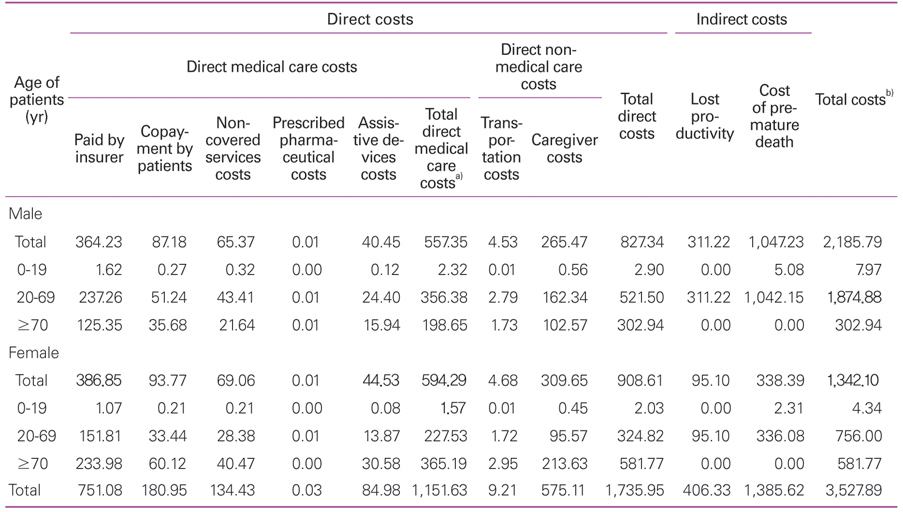
The total economic cost of stroke was $3.53 billion: $1.87 billion for hemorrhagic stroke and $1.66 billion for ischemic stroke (Table 1). Direct costs were estimated to be approximately 49% of this total, with indirect costs counting for the remaining 51%. In the analysis of direct costs, direct medical care costs were $1.15 billion and direct non-medical costs were $584 million, which was 50% of the total direct medical care costs. In the breakdown of indirect costs, costs due to premature death were $1.39 billion and costs due to lost productivity were $406 million. The total indirect costs were estimated to be $1.79 billion.
By gender, males accounted for $2.19 billion of the total cost, compared to a total cost of $1.34 billion for females. By age group, the economic burden of male patients ($1.88 billion) aged between 20 and 69 was higher than that of females ($760.34 million), whereas female patients ($581.77 million) over the age of 70 accounted for approximately 1.9 times the costs of males in the same age group ($302.94 million).
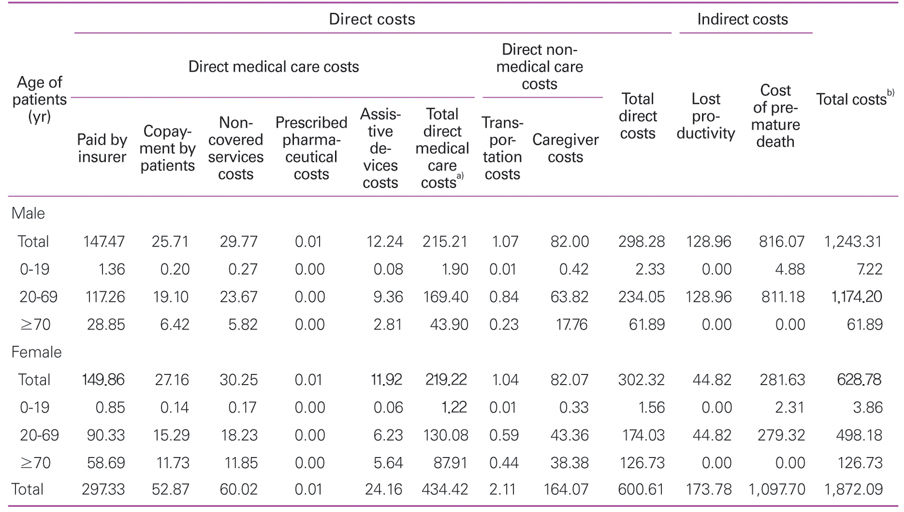
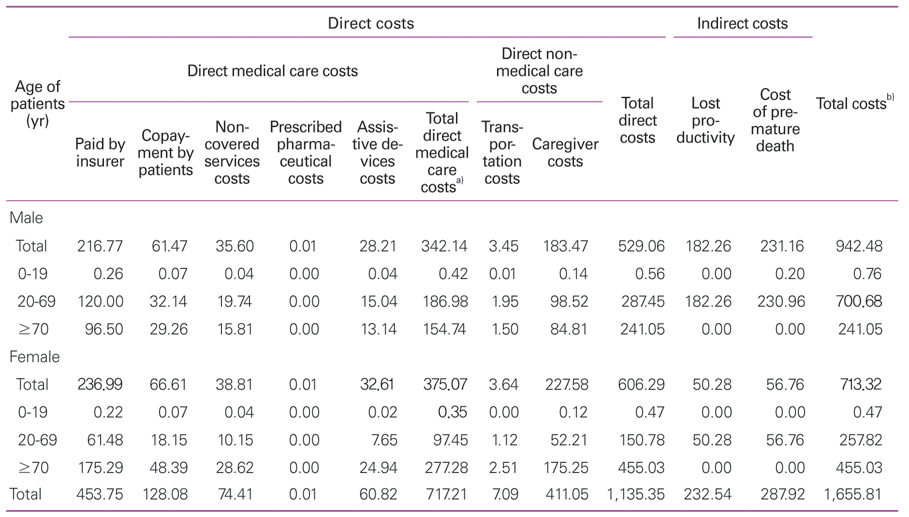
Comparing the costs of hemorrhagic stroke with ischemic stroke, the cost of hemorrhagic stroke was approximately 1.13 times higher than ischemic stroke. For hemorrhagic and ischemic stroke, the direct costs were $600.61 million and $1.14 billion, respectively, while the indirect costs were $1.27 billion and $520.46 million, respectively. For the hemorrhagic stroke costs, the indirect costs were more than twice as high as the direct costs, while the direct costs of ischemic stroke were 2.16 times more than the indirect costs.
By age group, cost of premature death for hemorrhagic stroke was the highest burden aged 20 to 69 ($1.09 billion), ischemic stroke was similar result both the cost of premature death and direct medical costs ($287.72 million, $284.43 million). The direct costs over the age of 70 were $188.62 million for hemorrhagic stroke, $696.08 million for ischemic stroke and the cost of ischemic stroke was 3.7 times more than that of hemorrhagic stroke (Tables 2,3).
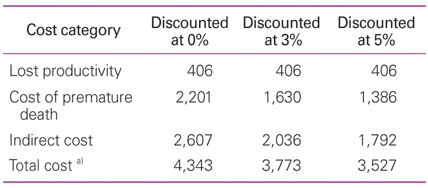
In the sensitivity analysis of the discount rate, the cost of premature death ranged from $1.39 billion to $2.20 billion. Indirect costs ranged from $1.79 billion to $2.61 billion. Consequently, the total economic burden of stroke ranged from $3.53 billion to $4.34 billion. This is between 5.2% and 6.4% of the total cost of health care in 2010 ($68 billion) [5]. A sensitivity analysis of outpatient case definitions was also performed. The estimated total cost for one outpatient claim was $3.86 billion, which was increased than three outpatient claims by 9.3%. The cost of outpatient case ranged from $71.80 million (present criteria) to $357.47 million (one outpatient claim) (Tables 4,5).
Discussion
This study estimated the economic burden of stroke using data sources such as the NHIC and survey data. In 2010, 396,843 patients in Korea were diagnosed and treated in stroke. The total cost of stroke was estimated to be $3.53 billion: $1.87 billion for hemorrhagic stroke and $1.66 billion for ischemic stroke. The estimated cost of stroke was 0.35% of the Korean gross domestic product (GDP) and 5% of national health care expenditures [5].
By cost item, total direct medical costs were $1.15 billion, total non-medical costs were $584 million, and indirect costs were $1.79 billion. Direct costs were 2.6% of the total cost of health care in 2010, and were 1.2 times larger than the costs of lung cancer ($1.41 billion) in 2005 [22]. Also the proportion of 0.35% is lower than all musculoskeletal diseases (0.7% of GDP in 2008) or all cancer (1.75% of GDP in 2005), but is a substantial burden in Korea [14,22]. In the sensitivity analysis, the rate of increase of the total economic burden of stroke ranged from 6.9% to 23.13%, as seen when applying the different discount rates and outpatient case definitions.
In 2005, the economic burden of stroke in Korea was estimated as $3.38 billion, of which medical costs were $1.02 billion, which was approximately 7.8% of national health care expenditures and 0.46% of the GDP in Korea that year [8]. In this study, there was a difference in stroke-related costs between 2005 and 2010, and a cost increase of almost $0.15 billion from 2005 to 2010.
This distinction may be the burden of rising direct medical costs due in part to the development of new diagnostic equipment, the increased use of more expensive equipment and inflation of prices [8]. However, methodological differences could also be partly responsible. First, Lim et al. [8] included transient ischemic attacks (TIA, G45) patients with the stroke patients classified as I60-I69, and defined them as adult patients over age 20 who have claimed stroke as the primary or secondary diagnosis. However, in this study, we defined stroke patients who had at least one inpatient or three outpatient claims as I60-I63, and patients with TIA were excluded. In addition, we estimated the costs of entire age groups with stroke as the primary disease. Second, in the study by Lim et al. [8], the cost of assistive devices was excluded due to the difficulty involved in quantification. In contrast, our study included the cost of assistive devices. Considering that non-covered care represented 3% to 4% of the total costs, the cost of assistive devices is an also important part of the overall economic burden of stroke. Last, the results of the KNHANES for transportation were applied in the estimation of direct non-medical costs, and transportation costs were estimated to be 0.7% of the total direct costs. However, because we hypothesized that patients who suffer from chronic diseases such as stroke would rarely travel to another region to receive treatment, we estimated the cost of stroke-specific transportation from Korea Health Panel data. Therefore, the transportation costs were assessed as 0.5% of the total direct costs, which is lower than that used by Lim et al. [8].
In 2010, direct costs were 49% and indirect costs were 51% of the total costs, compared to 2005 where the direct costs were 31% and indirect costs were 69% of the total costs [8]. Our results showed a trend similar to that seen in many other studies. In studies done in other countries, direct costs have been shown to be higher than indirect costs in spite of methodological differences [1,2]. A study conducted in the UK (2004) estimated direct costs to be $9.40 billion, of which $6.15 billon (65%) were medical costs, $2.05 billion (22%) were non-medical costs, and $1.07 billion (12%) were costs due to productivity loss. In addition, in a study conducted in the EU, direct costs (61.1%) were found to be greater than indirect costs (38.9%) [1,2]. The results of the present study showed that the direct costs associated with stroke increased from 2005 to 2010. Since stroke occurs primarily in people over the age of 60, indirect costs caused by productivity loss and premature death were relatively small in this age group, as compared to those of young adults and middle-aged people. Therefore, indirect costs are not a large part of the overall economic burden of this disease compared to direct costs.
The cost of hemorrhagic stroke was higher than the cost of ischemic stroke according to disease group. In addition, some differences in cost distribution were observed. In the analysis of hemorrhagic stroke costs, indirect costs (67.92%) were the highest, followed by direct medical costs (23.20%) and direct non-medical costs (8.87%). For ischemic stroke, direct medical costs (43.41%) were the greatest burden, followed by indirect costs (31.43%) and direct non-medical costs (25.25%). According to age group, the estimated cost for patients between the ages of 20 and 69 with hemorrhagic stroke was higher than for those with ischemic stroke: 89.33% vs. 57.88%, respectively. Hemorrhagic stroke, which carried a heavier burden in indirect costs, occurred in the younger age groups and had a higher fatality rate, accounting for relatively greater predicted life-time earnings foregone. For ischemic stroke, the cost of health care use was high due to the large prevalence of the disease.
Between the male and female patients, men had a heavier economic burden of disease than women, and a subsequently higher socio-economic cost. However, females had higher total direct medical costs and direct non-medical costs than did males. Males incurred higher indirect costs compared to females. This is because males typically experience stroke at an earlier age. On the other hand, women had higher direct costs than indirect costs and had higher overall medical costs due to the gender differences in stroke. In a study of the functional outcomes after stroke and the use of medical resources, it was found that females experience stroke later in life compared to males, and their number of inpatient days was slightly longer [23]. Hence, their functional outcome after the onset of stroke is worse than that seen in males. Females also have a higher risk of developing severe disability, resulting in subsequently higher direct medical costs. Studies in Europe, Canada, and Korea have shown similar findings [23-26]. Therefore, intervention strategies which take into account gender differences in stroke outcome should be considered.
When we compare the results according to age group, the economic burden of stroke in patients over the age of 60 accounted for 49.45% of the total cost (data not shown). This phenomenon is associated with the high prevalence of stroke after the age of 65. In a study of the relationship between stroke and TIA prevalence in the elderly Korea population, the prevalence of stroke increased until the ages of 75 and 79, but decreased thereafter [27]. In addition, institutionalization costs incurred by elderly patients who suffer an incapacitating stroke will most likely increase, and ultimately the social costs will increase as well [28]. Therefore, Korea requires a health care policy to manage stroke that matches the needs of our rapidly aging society.
This study has several limitations. First, we were not considered the cost of disability after stroke. There was no disability data in Korea National Health Insurance Claims Database, such as the modified Rankin Scale (mRS). Especially, the mRS was important to expect the extent of disability in stroke survivors and the estimation of rehabilitation cost due to disability was necessary after stroke [29]. Thus, the economic burden of stroke may have been underestimated. Second, we were unable to estimate the costs of house repairs, health supplement food, herbal medicine, and long-term use of a nursing facility due to limitations in the data. The economic burden could be even heavier when these costs were included. Third, it has been reported that 15.7% of stroke patients use over-the-counter (OTC) products for the prevention of secondary complications, which should be included in drug-related costs. However, because a large number of aspirin-type OTC products are also used to prevent hypertension and cardiocerebrovascular diseases, the costs of these types of drugs were excluded from this study to avoid overestimation [30]. Fourth, there may have been validity problem of survey sampling in the cost of assistive devices, and there is a possibility of overestimation of stroke burden. Finally, because it was difficult to quantify the deterioration in quality of life resulting from social and environmental changes, such as psychological pain and anxiety, these factors were excluded from the cost analysis. If these costs were considered, the economic burden due to stroke could be even higher.
Conclusion
In this study, the economic burden of stroke was estimated using current nationally representative data
and was determined to be in $3.53 billion in costs, the equivalent of 0.35% of the GDP. The economic burden of stroke has increased by 4.4% from 2005 to 2010. With the Korean society increasingly aging, the economic burden of stroke will continue to be substantial into the future. Therefore, we must endeavor to reduce the economic burden of stroke in Korea and the more accurate estimation of economic burden would help this goal.