Introduction
Statistics Korea has published infant, maternal, and perinatal mortality statistics to increase the exactness of death statistics and to provide basic data supporting maternal and child health policies. These data can be used as basic information for comparative health indices across countries and for research into risk factors for dangerous deliveries. They were provided through the Korea Statistical Information Services (
http://kosis.kr/eng/) and the Microdata Integrated Service (
https://mdis.kostat.go.kr/index.do). The purpose of this article is to summarize these statistical data and to present current characteristics and trends in the infant, maternal, fetal, and perinatal mortality rates.
Methods
1. Data collection
Infant, maternal, and perinatal mortality statistics were produced based on the following data: death certificates according to Act on the Registration, etc. of Family Relationships [
1]; reports of infant deaths from crematoriums and fetal death certificates according to the Act on Funeral Services, etc. [
2]; and a supplementary survey for infant, maternal, and fetal deaths. There was a possibility of omitting infant death notices; therefore, reports from crematoriums concerning infant deaths were added to minimize possible omissions. The supplementary survey for infant, maternal, and fetal death was conducted to obtain additional information such as antenatal care-related variables and the Apgar score,in addition to the items contained on the death certificates for infant, maternal, and fetal deaths. The analysis extended from January 1, 2014 to December 31, 2014.
2. Classification of causes of death
The underlying causes of death described in the death certificates according to the International Classification of Diseases (ICD) by the World Health Organization were first selected [
3]. The results were also classified according to the Korea Classification of Diseases [
4]. In order to make an accurate cause of death statistics, other related data were utilized from the National Health Insurance Service of Korea, National Cancer Center of Korea, National Forensic Service of Korea, Korea National Police Agency, and Korea Centers for Diseases Control and Prevention. In the statistical tables, maternal deaths were classified based on general mortality-condensed list (103 items), while infant, perinatal, and fetal deaths were classified based on the Infant and Child Death Summarized Classification (67 items) (
Supplementary Table 1).
3. Definition of terms used in this article
Infant death: A live birth with death occurring within the first year (365 days)
Infant mortality rate: The number of infant deaths within 1 year (365 days) after birth that occur for every 1,000 live births in a given year
Neonatal death: A live birth that results in death within 28 days
Neonatal mortality rate: Number of neonatal deaths within 28 days after birth that occur for every 1,000 live births in a given year
Maternal death: The death of a woman while pregnant or within 42 days of termination of pregnancy, irrespective of the duration and site of the pregnancy, from any cause related to or aggravated by the pregnancy or its management, but not from accidental or incidental causes (http://www.who.int/healthinfo/statistics/indmaternalmortality/en/)
Direct obstetric death: Deaths resulting from obstetric complications of the pregnancy (pregnancy, labor, and puerperium), from interventions, omissions, incorrect treatment, or from a chain of events resulting from any of the above (ICD-10)
Indirect obstetric death: Deaths resulting from previous existing disease or disease that developed during pregnancy, which were not due to direct obstetric causes, but which were aggravated by the physiologic effects of pregnancy
Maternal mortality ratio: The number of deaths of women while pregnant or within 42 days of termination of pregnancy, irrespective of the duration and site of the pregnancy, from any cause related to or aggravated by the pregnancy or its management per 100,000 live births in a given year
Maternal mortality rate: The number of deaths of women while pregnant or within 42 days of termination of pregnancy, irrespective of the duration and site of the pregnancy, from any cause related to or aggravated by the pregnancy or its management per 100,000 women of child-bearing years (15 to 49 years old) in a given year
Lifetime risk of maternal death: The probability that a 15-year-old woman will eventually die from a maternal cause. It is calculated by multiplying the maternal mortality ratio in a given year by the total fertility rate of 1.2.
Total fertility rate: The number of children who would be born per woman if she were to pass through the child-bearing years (15 to 49 years old) bearing children according to the current schedule of age-specific fertility rates
Perinatal death: This category includes infant deaths that occur at less than 7 days of age and fetal deaths with a stated or presumed period of gestation of 28 weeks or more. The term is used in this study in accordance with the definition of the United Nations and Organization for Economic Cooperation and Development [5,6]; however, the definition by World Health Organization according to which perinatal death occurs at less than 7 days of age and fetal death occurs with a stated or presumed period of gestation of 22 weeks or more also can be calculated from the present data [7].
Perinatal mortality rate: The number of infant deaths that occur at less than 7 days of age and fetal deaths with a stated or presumed period of gestation of 28 weeks or more that occur for every 1,000 live births in a given year
Fetal death: Deaths before the complete expulsion or extraction from the mother of a product of human conception during the duration of pregnancy, that is not an induced termination of pregnancy (in this article, the duration of pregnancy is defined as a gestational age of 16 weeks or more)
Fetal mortality rate: The number of fetal deaths that occur for every 1,000 live births and fetal deaths in a given year
Results
1. Infant deaths
The number of infant deaths in 2014 was 1,305 out of 435,435 live births; therefore, the infant mortality rate (per 1,000 live births) was 3.0 (
Supplementary Table 1).
Figure 1 shows the number of live birth and the infant mortality rate from 2004 to 2014. There was a continuous decrease in the infant mortality rate, from 4.7 in 2004 to 3.0 in 2014. The number of male infant deaths was 715 and that of female infants was 590. The infant mortality rate of males was 3.2 and that of females was 2.8. According to age at death, the number of deaths during the early neonatal period (less than 7 days) was 468 (35.9%), the number of deaths during the late neonatal period (between 7 days and 27 days) was 275 (21.1%), and the number of infant deaths in the post-neonatal period (28 days and over) was 562 (43.1%) (
Supplementary Table 2). According to gestational age, the number of premature infant deaths among the preterm infants was 785 (60.2%). There were 520 deaths (39.8%) among term infants (37 weeks and over) (
Supplementary Table 3). The infant mortality rate according to maternal age was 9.8 for mothers younger than 20 years old, and 5.9 for mothers 40 years of age or older (
Supplementary Table 4). According to birth weight, 775 infant deaths (59.4%) occurred among low-birth-weight infants (less than 2.5 kg), while 530 (40.6%) took place among those with a birth weight of 2.5 kg. The infant mortality rates among low-birth-weight infants were 31.9, 32.5, and 31.2 in 2012 to 2014. The corresponding rate for infants with a birth weight of 2.5 kg or more from 2012 to 2014 was 1.3 in all years (
Supplementary Table 5). The causes of death are classified in
Table 1. The most common causes of death were respiratory distress of the newborn (214), congenital malformations of the heart (100), bacterial sepsis (87), and sudden infant death syndrome (80).
2. Maternal deaths
The number of maternal deaths was 48 in 2014. The maternal mortality ratio (per 100,000 live births) was 11.0. The maternal mortality rate (per 100,000 women of childbearing years [15 to 49 years old]) was 0.37 (
Supplementary Table 6). The lifetime risk of maternal death was 1/6,274. The proportion of maternity among women aged over 35 years old was 21.6% in 2014 (
Supplementary Table 6). The average age of delivery was 32.0 years old. Usually, the maternal mortality ratio increases as maternal age increases; however, in 2014, the maternal mortality ratio among women 40 years of age and older decreased (
Figure 2,
Supplementary Table 7).
Maternal deaths according to the death period were distributed as follows: 5 deaths occurred before delivery, 31 deaths were postpartum,and 12 were unknown. Of the postpartum deaths, 14 occurred from 0 to 1 day postpartum, 9 occurred 2-7 days postpartum, 1 occurred 8 to 14 days postpartum, and 7 occurred 15 to 42 days postpartum (
Supplementary Table 8). The pregnancies involved in cases of maternal death resulted in 31 live births, 8 abortions or fetal deaths, 5 pregnant deaths, and 4 undefined cases (
Supplementary Table 9). The causes of maternal death are presented in
Table 2.
3. Perinatal deaths
The number of perinatal deaths according to definition I (infant deaths under the age of 7 days and fetal deaths at 28 weeks of gestation or more) in 2014 was 1,365 and the perinatal mortality rate was 3.1. The number of perinatal deaths according to definition II (infant deaths under the age of 7 days and fetal deaths at 22 weeks of gestation or more) was 2,630, and the corresponding rate was 6.0 (
Supplementary Table 10). The number of deaths in males was 618, while 577 deaths occurred in females, and the sex was unidentified in 170 deaths (
Supplementary Table 11). Perinatal deaths according to gestational age are presented in
Figure 3 and
Supplementary Table 12. Perinatal deaths according to maternal age are shown in
Table 3. The high proportion of perinatal deaths in mothers aged 30 to 34 years old is due tothe high proportion of deliveries within that age group. The perinatal mortality rate according to birth weight from 2012 to 2014 is presented in
Figure 4 and
Supplementary Table 13. Perinatal deaths by cause of death from 2012 to 2014 are presented in
Supplementary Table 14. Perinatal deathsby cause of death and gestational age are presented in
Table 4.
4. Fetal deaths
The number of fetal deaths (after the gestational age of 16 weeks) was 5,317, that after the gestational age of 22 weeks was 2,162, and that after 28 weeks was 897. The fetal mortality rate (per 1,000 live births) was 12.1; that after the gestational age of 22 weeks was 4.9; and that after 28 weeks was 2.1 (
Supplementary Table 15). Of the 5,317 deaths, 1,928 were in males and 1,506 were in females, while the sex was unknown sex in 1,983 deaths (
Supplementary Table 16). According to gestational age, 3,155 deaths occurred from 16 to 21 weeks, 1,265 from 22 to 27 weeks, and 897 at 28 weeks and more (
Supplementary Table 17). Fetal deaths according to maternal age are presented in
Figure 5. The largest proportion was found among mothers aged between 30 and 34 years old because this group accounted for the most deliveries. The fetal mortality rate was the highest among mothers younger than 20 (
Supplementary Table 18). According to birth weight, 3,501 deaths occurred in fetus with a birth weight below 1.5 kg, 127 in fetuses with a birth weight from 1.5 to 2.0 kg, 112 in fetuses with a birth weight from 2.0 to 2.5 kg, 249 in fetuses with a birth weight of 2.5 kg or more, and the weight of 1,328 fetuses was not identified (
Supplementary Table 19). The causes of fetal death are presented in
Table 5. The most common cause was “condition originating in the perinatal period, unspecified.” Recent trends in the causes of fetal death are presented in
Supplementary Table 20.
Discussion
1. Infant deaths
The infant mortality rate (per 1,000 live births),which was 3.0, was the same as the rate in 2013 (3.0) and similar to that in 2012 (2.9). The infant mortality rate has continuously decreased from 4.7 in 2004 to 3.0 in 2014 (
Figure 1). Regarding the causes of death, respiratory distress decreased from 22.1% in 2012 to 16.4% in 2014, while bacterial sepsis increased from 4.7% to 6.7%. Sudden infant death syndrome decreased from 7.0% to 6.1% (
Table 1). The decrease in the absolute number of infant deaths and the change in the proportions of the causes of death indicate that care for respiratory distress for infants has improved dramatically in hospitals. The increase of bacterial sepsis as a cause of death corresponds to an increase in the immunocompromised status of the infants who suffered from infections. It may still be difficult to treat infantile sepsis with favorable results. Although there was a higher infant mortality rate in mothers on each end of the age range, with a rate of 9.8 in mothers younger than 20 years old and 5.9 in those 40 and older, the contributions of these groups to overall infant mortality, 1.9% and 5.4%, were still low. The 24 times higher mortality rate in low-birth-weight babies in comparison to those weighing 2.5 kg or more shows that low birth weight was the most important risk factor for infant death.
2. Maternal deaths
In contrast to the higher infant mortality in mothers younger than 25 years old, the maternal mortality ratio of the same age group was low, at 4 out of 100,000 live births (
Figure 2). It increased continuously according to age in 2012 and 2013; however, there was a decrease in the maternal mortality ratio among the age group of 40 or older, to 18.1 in 2014 from 54.4 in 2013. This is difficult to explain, but may be the result of the good obstetrical care provided to mothers in that age group or the result of the small number of maternal deaths, with 48 deaths recorded in 2014. Obstetrical embolism (11) and postpartum hemorrhage (10) were the most common causes of maternal death. The pre-term monitoring of risk for embolism and hemorrhage should be enforced to prevent maternal deaths.
3. Perinatal deaths
The perinatal mortality rate was 3.1 in 2012, 3.3 in 2013, and 3.1 in 2014 (
Table 3). The perinatal mortality rate was highest in mothers younger than 20 (
Table 3). This phenomenon was the same as observed for the infant mortality rate. The perinatal mortality rate of babies less than 1.5 kg was 194.5 in 2014; while that of babies weighing 2.5 kg and more was 0.9. Therefore, birth weight is the most important risk factor for perinatal mortality (
Figure 4). Respiratory distress of the newborn and congenital malformation of the heart were the major causes of death (
Table 4). Regarding risk factorsfor perinatal mortality, fetal growth restriction is known to be a major cause of increased perinatal mortality in post-term pregnancies in Korea,as those with a birth weight percentile less than 10% showed increased perinatal mortality rates at 42 weeks of gestation [
8]. In a tertiaryreferral hospital from 2005 to 2013, fetal hydrops cases occurred in 24. 4 per 10,000 deliveries, and the perinatal mortality of these cases was 26 out of 42 cases (62.9%) [
9]. These are cases in which a congenital malformation caused perinatal death.
4. Fetal deaths
The fetal mortality rate during the gestational age range of 16 to 21 weeks was 991.8; while the rate for the gestational age range of 28 weeks and more was 2.1 (
Figure 5). The cause of death of a “condition originating in the perinatal period, unspecified” accounted for the largest proportion (85.3%). “Down's syndrome and other chromosomal abnormalities” were the next important cause of death (3.4%). The strength and importance of the above data lie in the fact that this is one of the most comprehensive and accurate datasets on infant, maternal, and perinatal mortality statistics in the world. The staff of Statistics Korea not only referred to death registration data and the reports of crematoriums of infant and fetal deaths, but also utilized as upplementary survey for infant, maternal and fetal deaths.Therefore, the data presented in this study can be used to help prevent infant and maternal deaths based on accurate information. Preventing infant and maternal deaths is not easy, although Korea has an excellent medical health system as the maternal age becomes older. More intensive antepartum pregnancy care with appropriate screening for risk factors will reduce maternal and infant deaths. Additionally, pregnant women younger than 20 years old should receivemore intensive care to prevent fetal deaths. In the United States of America, the fetal mortality rate in 2013 in unmarried women was found to be 1.5 times higher than the rate in married women [
10]. It is possible to analyze marriage status through the Microdata Integrated Service. In Korea, the same phenomenon for unmarried women is expected. The fetal death rate in women younger than 20 years old was 82.4. A number of fetal deaths among mothers in this age group are believed to be due to the improper pregnancy carereceived by unmarried women. This proposal should be verified through further analysis.
Conclusion
The infant, perinatal, maternal, and fetal death rates have been consistent in recent years in Korea. The maternal mortality ratio of pregnant women 40 years of age and older in 2014 decreased dramatically from that observed in 2013; however, this may simply reflect the small number of deaths (48). Therefore, continuous follow-up should be conducted. To prevent fetal deaths in women younger than 20 years old, specific prevention strategies should be considered.
Peer Reviewers' Commentary
Death statistics are the most basic statistical information, which is important in determining health status and has a very important impact on health policy formulation. I am very fortunate to have the statistics for the newborn, maternity and perinatal deaths since the 2014 general mortality statistics were published in the March 2016 issue. According to the paper, the maternal and infant-related mortality statistics for 2014 are very good and can be confirmed to be improving continuously. I would like to be able to take a look at the statistics related to death in Korea in a multifaceted way after similar analysis is done in the future.
[Editorial comment]
Acknowledgement
Data collection and the analysis of the raw data were done as a part of budget of the Korean government.
Supplementary Materials
Supplementary Table 1
Infant deaths, infant mortality rates, and trends in live births, 2012 to 2014, Republic of Korea
Supplementary Table 2
Infant deaths, percentages, and infant mortality rates by sex and duration of life, 2012 to 2014, Republic of Korea
Supplementary Table 3
Infant deaths, percentages, and infant mortality rates by gestation period, 2012 to 2014, Republic of Korea
Supplementary Table 4
Infant deaths, percentages, and infant mortality rates by maternal age, 2012 to 2014, Republic of Korea
Supplementary Table 5
Infant deaths, percentages, and infant mortality rates by birth weight, 2012 to 2014, Republic of Korea
Supplementary Table 6
Maternal deaths, maternal mortality ratio, maternal mortality rate, lifetime risk of maternal deaths, and the number of live births, 2012 to 2014, Republic of Korea
Supplementary Table 7
Maternal deaths, maternal mortality ratio, and percentage by age, mean values for the period of 2012 to 2014, Republic of Korea
Supplementary Table 8
Maternal deaths and percentages by death period, 2012 to 2014, Republic of Korea
Supplementary Table 9
Maternal deaths and percentages by pregnancy outcomes, 2012 to 2014, Republic of Korea
Supplementary Table 10
Perinatal deaths and mortality rate, 2012 to 2014, Republic of Korea
Supplementary Table 11
Perinatal deaths, percentage, and mortality rate by sex, 2012 to 2014, Republic of
Korea
Supplementary Table 12
Perinatal deaths, component ratio, and mortality rate by gestation period, 2012 to 2014, Republic of Korea
Supplementary Table 13
Perinatal deaths and percentage by birth weight, 2012 to 2014, Republic of Korea
Supplementary Table 14
Perinatal deaths and percentages by main category of causes of death, 2012 to 2014, Republic of Korea
Supplementary Table 15
Fetal deaths, fetal mortality rate, and trend of the number of total births, 2012 to 2014, Republic of Korea
Supplementary Table 16
Fetal deaths and percentages by sex, 2012 to 2014, Republic of Korea
Supplementary Table 17
Fetal deaths and percentages by gestational age, 2012 to 2014, Republic of Korea
Supplementary Table 18
Fetal deaths and percentages by maternal age, 2012 to 2014, Republic of Korea
Supplementary Table 19
Fetal deaths and percentages by birth weight, 2012 to 2014, Republic of Korea
Supplementary Table 20
Fetal deaths and percentages by death cause, 2012 to 2014, Republic of Korea
References
1. Act on the Registration, etc. of Family Relationship. 2016. 05. 29. No. 14169.
2. Act on Funeral Services, etc.. 2013. 08. 06. No. 11998.
7. World Health Organization. Neonatal and perinatal mortality: country, regional and global estimates [Internet] Geneva: World Health Organization. cited 2017 Apr 11. Available from:
http://apps.who.int/iris/handle/10665/43444
8. Seo K, Won HJ, Cho JS, Park YW, Kim SK, Lee K. Fetal growth restriction was a major cause of increased perinatal mortalities of postterm pregnancies. Korean J ObstetGynecol 2003;46:2033-2038.
10. MacDorman MF, Gregory EC. Fetal and perinatal mortality: United States, 2013. Natl Vital Stat Rep 2015;64:1-24.
Figure 1
Number of live births and infant mortality rate from 2004 to 2014, Republic of Korea
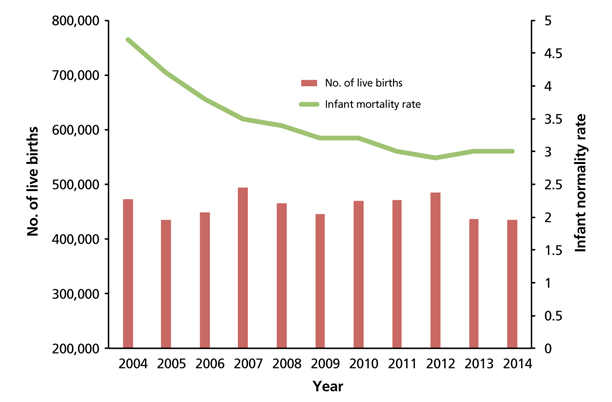
Figure 2
Maternal mortality ratio by maternal age from 2012 to 2014, Republic of Korea.
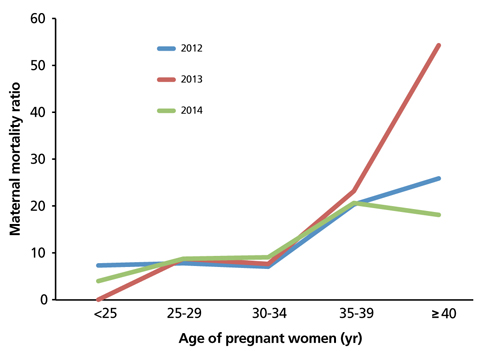
Figure 3
Perinatal deaths according to gestational age in 2014, Republic of Korea.
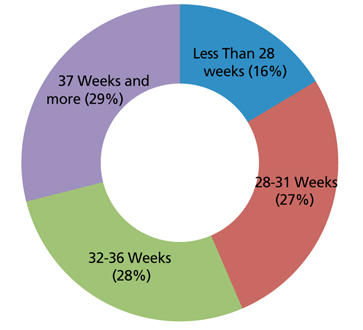
Figure 4
Perinatal mortality rate according to birth weight in 2014, Republic of Korea.

Figure 5
Fetal mortality rate according to maternal age in 2014, Republic of Korea.
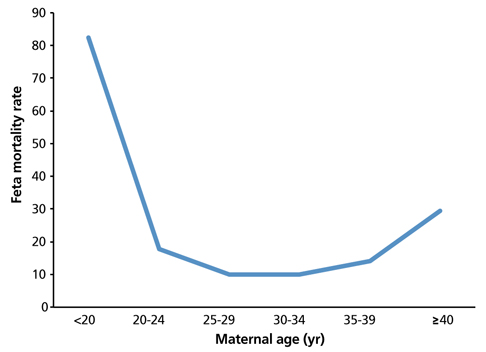
Table 1
Number of infant deaths according to cause of death and the distribution ratio from 2012 to 2014
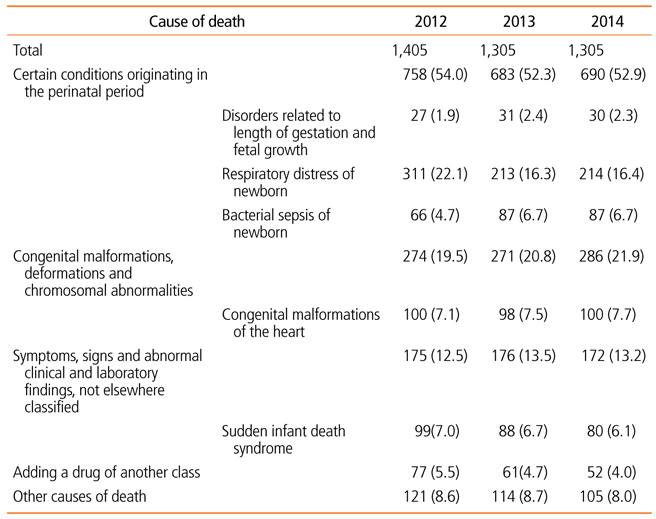
Table 2
Number of maternal deaths and the distribution ratio according to cause of death in 2014, Republic of Korea
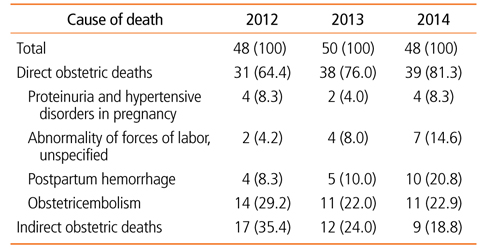
Table 3
Perinatal deaths and perinatal mortality rate according to maternal age
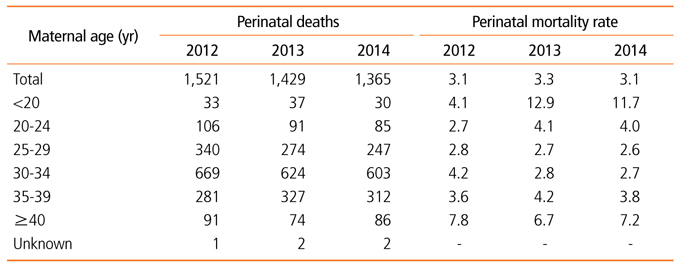
Table 4
Number of perinatal deaths according to cause of death and gestational period
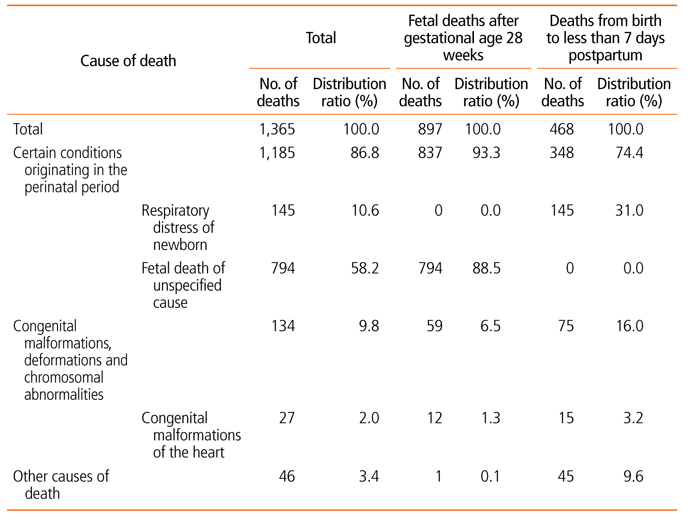
Table 5
Fetal mortality rate according to maternal age in 2014, Republic of Korea.