우리나라 2019년도 사망원인의 통계분석
Statistical analysis of the cause of death in Korea in 2019
Article information

Trans Abstract
Background
This study aimed to present and analyze the causes of death in the Korean population in 2019.
Methods
Based on the Korean Standard Classification of Diseases and Causes of Death and the International Statistical Classification of Diseases and Related Health Problems, 10th revision, cause-of-death data for 2019 from Statistics Korea were examined.
Results
There were 295,110 total deaths, a decrease of 3,710 (-1.27%) from 2018. The crude death rate (the number of deaths per 100,000 people) was 574.8, a decrease of 7.6 (-1.3%) from 2018. The top ten causes of death, in descending order, were malignant neoplasms, heart disease, pneumonia, cerebrovascular disease, intentional self-harm, diabetes mellitus, Alzheimer disease, liver disease, chronic lower respiratory disease, and hypertension. Within the malignant neoplasm category, the top five organs affected were the lung, liver, colon, stomach, and pancreas (in the same order as in 2018). Alzheimer disease moved up from ninth to seventh on the list of leading causes of death in 2018. Among women, it ranked as the fifth leading cause of death, while pneumonia became the third leading cause of death.
Conclusion
These changes reflect the increasing number of women > 65 years who are vulnerable to cognitive impairment and infectious diseases. The Korean government must urgently take preventive and therapeutic measures against dementia, especially Alzheimer disease.
Introduction
1. Background
In 2014 [1], 2016 [2], and 2018 [3], a series of reports on the cause of death statistics in the Republic of Korea were published. This report is an update of a series of data from 2019. The three most notable aspects of the 2018 cause of death statistics were the following: the inclusion of Alzheimer disease in the top 10 causes of death, the exclusion of traffic accidents from the top 10, and the ranking of pneumonia as the third leading cause of death. The 2018 statistics reflect an increase in the population of older adults, who are more susceptible to infectious diseases [3]. Therefore, the 2019 statistics may allow us to track trends in causes of death.
Objectives: The objectives of this report are the same as those of a previous report on statistics in 2014: “Examining the corresponding changes in the causes of death in the Korean population may provide some insights regarding how to cope with issues of public health and welfare in developing countries as well as in other Organisation for Economic Cooperation and Development (OECD) countries” [1]. General issues related to causes of death were addressed, including the number of deaths and crude death rate, the number of deaths and mortality rates by age and sex, life expectancy, and trends in mortality rates by major causes. It also highlighted the causes of death related to the increase in the older population.
Methods
Ethics statement: This was a public data analysis; therefore, neither institutional review board approval nor informed consent was required.
Study design: This cross-sectional observational study was based on public data from Statistics Korea. It was described according to the STROBE Statement available from: https://www.strobe-statement.org/.
Setting, participants, data source, and measurement: The methods of data collection and analysis were the same as those used in a previous study on causeof- death statistics conducted in 2016 [2]. Data were obtained from death certificates issued in 2019 for Koreans residing in the Republic of Korea [4]. The midyear population figures used to calculate mortality rates were obtained from the Republic of Korea Population Register [5]. The causes of death were classified according to the recommendations of the World Health Organization [6]. The causes of death were classified according to the recommendations of the World Health Organization [6]. Additionally, the Korean Standard Classification of Diseases and Causes of Death (KCD-7) was used, as this complementary system is an adaptation of the International Statistical Classification of Diseases and Related Health Problems, 10th Revision (ICD-10), to Korean conditions [7]. More specifically, KCD-7 contains specific rare disease codes that reflect the health environment in Korea. For example, other specified arthropod-borne viral fevers are classified as A93.8 ICD-10 but are reported in KCD-7 as A93.80 (severe fever with thrombocytopenia syndrome) and A93.88 (other specified arthropod-borne viral fevers). The same 56 causes of death were used to create the cause of death ranking as in a previous cause of death report from 2016 [2].
Variables: All causes of death were used as variables in the data analysis, focusing on the leading causes of death.
Bias: There may be some biases in physicians’ death certificates documentation. However, cleared data of the Statistics Korea were included.
Study size: This study included the entire population of the Republic of Korea. There was no need to estimate the study size.
Statistical methods: Descriptive statistics were used to present the results of the data analysis.
Results
1. Number of deaths and crude death rate
The number of deaths in 2019 was 295,110, a decrease of 3,710 deaths (-1.3%) when compared to 2018. The number of male deaths was 160,322, a decrease of 865 (-0.5%) from 2017. The number of female deaths was 134,788, a decrease of 2,845 (-2.1%) from 2018. The average number of deaths per day was 809, a decrease of ten from 2018 (Suppl. 1, Figure 1, Data Set 1). The crude death rate (number of deaths per 100,000 population) was 574.8, decreasing 7.6 (-1.3%) from 2018. The crude death rate for males was 626.0, a decrease of 3.6 (-0.6%) from 2018. The crude death rate for females was 523.9, a decrease of 11.7 (-2.2%) from 2018. The crude death rate for males was 1.19 times that of females, similar to 2018 (Suppl. 1).
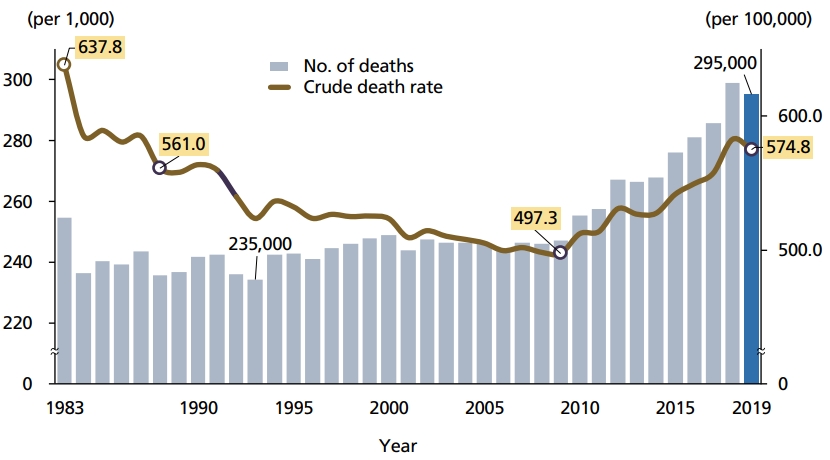
Numbers of deaths and the crude death rate from 1983 to 2019 in Korea.
2. Life expectancy
Life expectancy at birth was 83.3 years in 2019, 3.3 years longer than was in 2009 (80.0 years) and higher than was in 2018 (82.7 years). Life expectancy at birth was 80.3 years for men and 86.3 years for women in 2019, higher than in 2018 (79.7 years for men and 85.7 years for women). The gender difference in life expectancy at birth was 6.0 years in 2019. At age 40, men and women had a life expectancy of 41.3 years and 47.1 years, respectively. At age 60, the remaining life expectancy for men and women was 23.3 years and 28.1 years, respectively [8].
3. Deaths according to sex and age
The number of deaths decreased in most age groups in 2018. The proportion of deaths among those aged ≥80 years was 47.0%, an increase of 0.7%, and for men, this proportion was 34.0%, and for women, 62.4%, an increase of 13.1% and 16.1%, respectively, since 1999 (Suppl. 2).
The mortality rate decreased significantly among adults aged >70 years. The mortality rate (per 100,000 population) was lowest in the 1–9 age group (10.5) and highest in those aged ≥80 years (7,833.7). Mortality decreased for both sexes in most age groups, with a particularly significant decrease among those aged >70 years. The sex ratio of mortality (men to women) was greater than 1 (i.e., Higher for men) in all age groups. The sex ratio was highest (2.8) in the 60–69-year-age group (Suppl. 3).
4. Trends in mortality rates by major causes of death
1) Leading causes of death
The ten leading causes of death were malignant neoplasms (cancer), heart disease, pneumonia, cerebrovascular disease, intentional self-harm, diabetes mellitus, Alzheimer disease, liver disease, chronic lower respiratory disease, and hypertension. The ten leading causes of death accounted for 69.1% of all deaths. The top three causes of death (malignant neoplasms, heart disease, and pneumonia) accounted for 45.9% of all deaths, down from 0.9% in 2018. Compared to 2018, Alzheimer disease was seventh (up two ranks), while liver disease and chronic lower respiratory disease fell one rank to eighth and ninth, respectively. Alzheimer disease has steadily increased from 13th place in the world in 2009. Since most of the top 10 causes of death decreased compared with 2018, the overall mortality rates declined in 2019 (Suppl. 4). Mortality rates (per 100,000 people) and their proportions by cause of death and age in 2019 are shown in Suppl. 5. The ten leading causes of death in men and women are shown in Figure 2 (Suppl. 6). The mortality rate for men was 1.6 times higher than that for women. The changing trends in mortality due to the ten leading causes of death are shown in Figure 3.
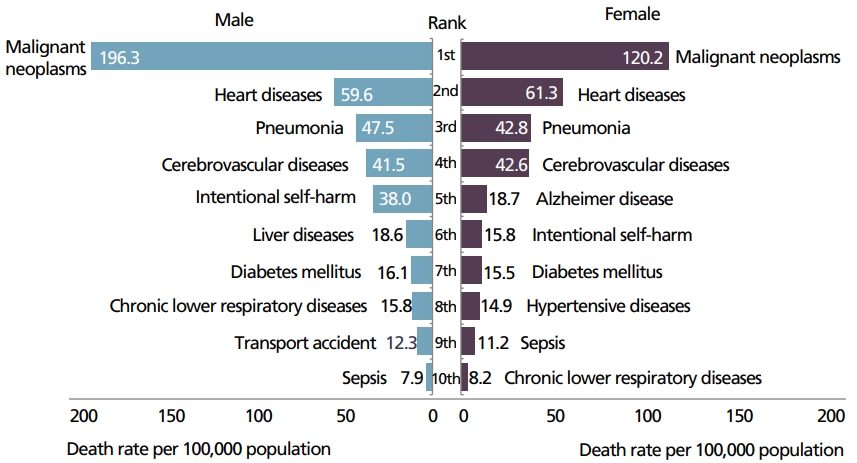
The 10 leading causes of death by sex in 2019 in Korea.
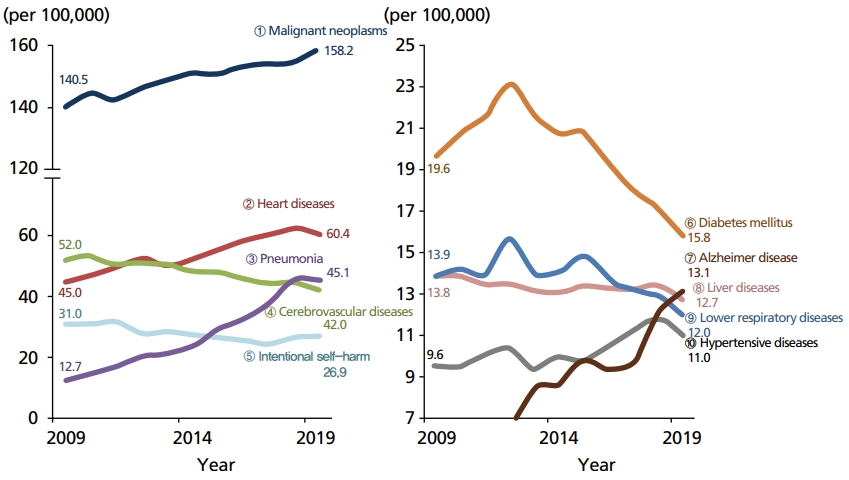
Trends in the mortality rates of 10 leading causes of death from 2009 to 2019 in Korea. The circled number is the ranking order of the cause of death in 2019.
2) Mortality due to malignant neoplasms
The mortality rate due to malignant neoplasms was 158.2 per 100,000 people, an increase of 3.9 (2.5%) in 2018. The cancer mortality rate was highest for lung cancer (36.2), followed in descending order by liver cancer (20.6), colon cancer (17.5), stomach cancer (14.9), and pancreatic cancer (12.5). Esophageal cancer (8.2%) and breast cancer (6.8%) death rates increased, while stomach cancer (-1.6%) and liver cancer (-0.3%) death rates decreased compared with 2018. The cancer mortality rate in men (196.3) was 1.6 times higher than that in women (120.2). The cancer mortality rate for males increased by 5.3% (2.8,%) and the cancer mortality rate for females increased by 2.5% (2.1%) compared with 2018. The mortality rates for lung, colon and pancreatic cancer increased, and the mortality rates for stomach and liver cancer decreased compared to 2018 (Suppl. 7, Figure 4). Mortality rates for breast cancer were highest among people aged 30–39 years old, liver cancer among people aged 40–49 years old, and lung cancer among people aged 60–69 years and older. The cancers with a high mortality rate (per 100,000 people) by age are shown in Suppl. 8.
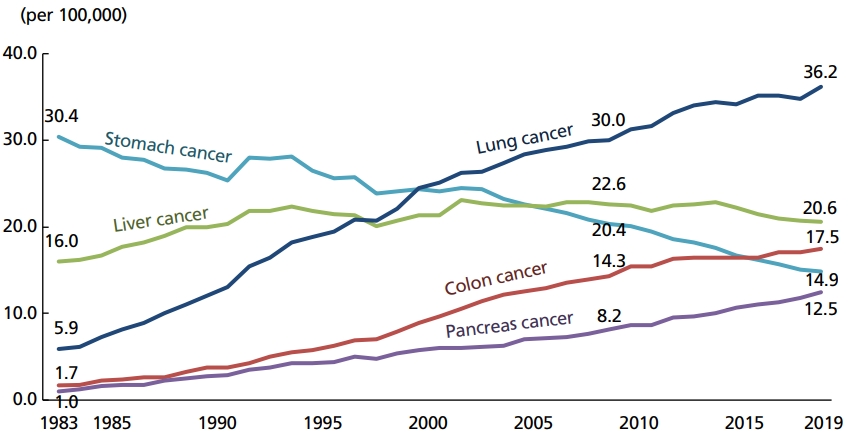
Trends in the mortality rates due to malignant neoplasms according to the involved organ from 1983 to 2019 in Korea.
3) Mortality due to heart diseases
The mortality rate of diseases of the circulatory system was 117.4, a decrease of 4.3% compared with 2018. These causes of death were mainly heart disease (60.4), cerebrovascular disease (42.0), and hypertension (11.0). Compared with 2018, mortality due to hypertensive diseases (-7.2%), cerebrovascular diseases (-6.0%), and heart diseases (-3.1%) decreased. The mortality rate due to diseases of the circulatory system was 1.1 times higher in women (122.7) than in men (112.0) (Suppl. 9). Diseases of the circulatory system show a trend of increasing mortality with age, especially after age 70 (Suppl. 10, Figure 5).
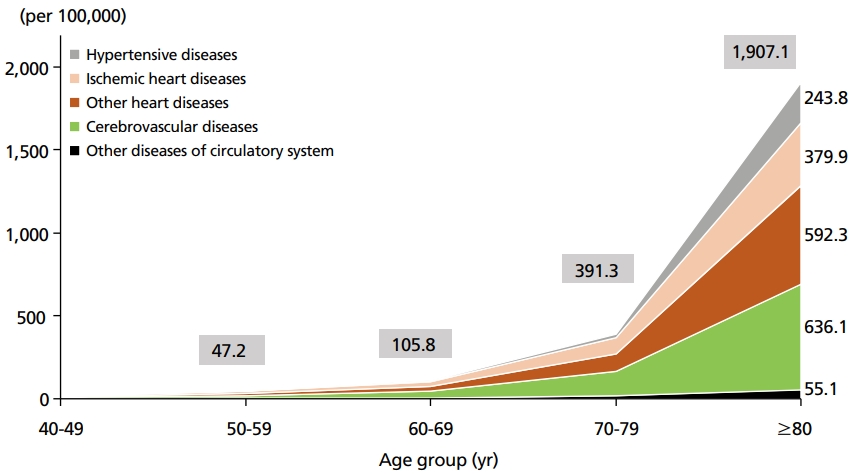
Mortality rates due to diseases of the circulatory system according to age in 2019 in Korea.
4) Mortality due to external causes of death
The proportion of all deaths caused by external causes was 9.2%, down 0.1% from 9.4% in 2018, and the mortality rate due to external causes was 53.1, down 2.8% from the previous year. The highest mortality rate due to external causes was for intentional self-injury (26.9), followed in descending order by transportation accidents (8.2) and falls (5.2). Compared with 2018, death rates decreased for poisoning (-25.6%), fire accidents (-24.7%), and drowning (-15.7%), while death rates increased for intentional self-injury (0.9%) (Figure 6, Suppl. 11). External causes of death were 2.3 times more common in men (73.8) than in women (32.6) (Suppl. 12).
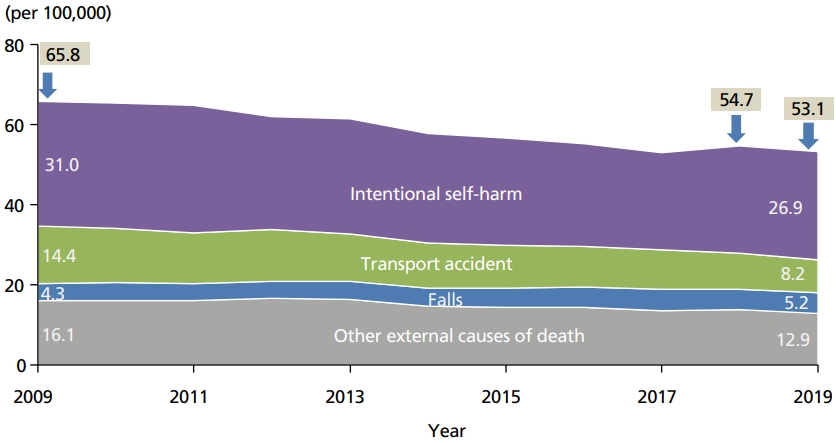
Trends in mortality rates due to external causes of death according to the specific cause from 2009 to 2019 in Korea.
Of the external causes of death, intentional self-harm was the most common among all age groups over ten years (Suppl. 12). The total number of deaths caused by intentional self-injury was 13,799, an increase of 129 (0.9%) compared to 2018. The death rate for intentional self-injury was 26.9, an increase of 0.2 (0.9%) compared to 2018 (Figure 7). The proportion of deaths from intentional self-harm increased in 20-29-yearolds (9.6%), teens (2.7%), and 60-69year-olds (2.5%) and decreased in 70-79-year-olds (-5.6%), 80-yearolds and older (-3.4%). Intentional self-harm was the leading cause of death among teens to those in their 30s and the second leading cause among people in their 40s and 50s (Suppl. 13).
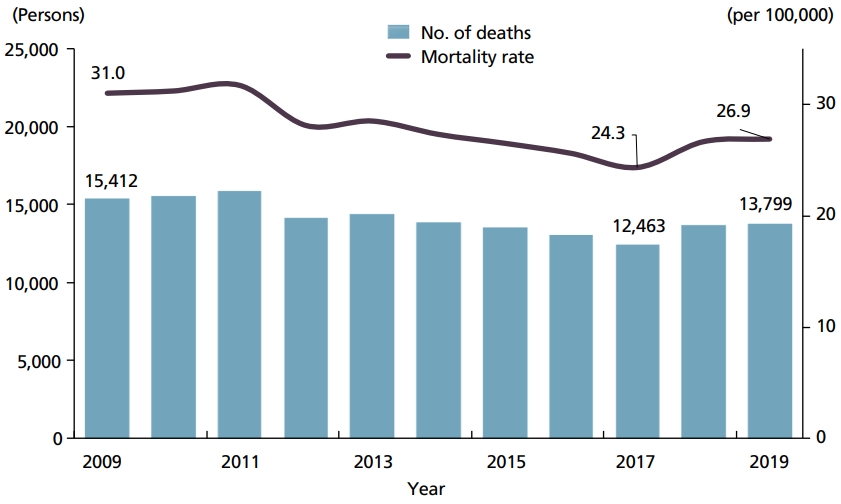
Number of deaths and mortality rates due to intentional self-harm from 2009 to 2019 in Korea
Compared with the OECD average of 11.3, Korea had the highest age-standardized rate of deaths from intentional self-harm (per 100,000 OECD standard population) at 24.6 in 2019. The standardized mortality rate eliminates differences in age structure by using the OECD standard population for international comparisons.
5) Alcohol-related mortality
The total number of alcoholrelated deaths was 4,694 (an average of 12.9 per day), including 216 in 2018. The alcohol-related mortality rate was 9.1, a decrease of 4.5% from 2018. The alcoholrelated mortality rate for males decreased compared with 2018 in all age groups except for 30-39-yearolds. Additionally, the mortality rate increased for women in their 20s (14.2%), 30s (7.5%), and 70s (10.9%) compared to 2018. The alcoholrelated mortality rate was 6.4 times higher for men (15.8) than for women (2.5). The alcohol-related mortality rate increased sharply after age 30 and peaked in the 50-59-year-old group (Suppl. 14).
6) Dementia-related mortality
For dementia-related deaths, only deaths caused by vascular dementia (F01), unknown dementia (F03), and Alzheimer disease (G30) were included. The total number of deaths due to dementia was 10,357, an increase of 6.3% compared with 2018 (Suppl. 15, Figure 8). The dementia mortality rate was 20.2, an increase of 1.2 (6.3%) from the 2018 mortality rate. The dementia mortality rate was 2.3 times higher in women (28.2) than in men (12.2). Compared with 2018, the mortality rate for dementia increased in both men (4.5%) and women (7.0%).
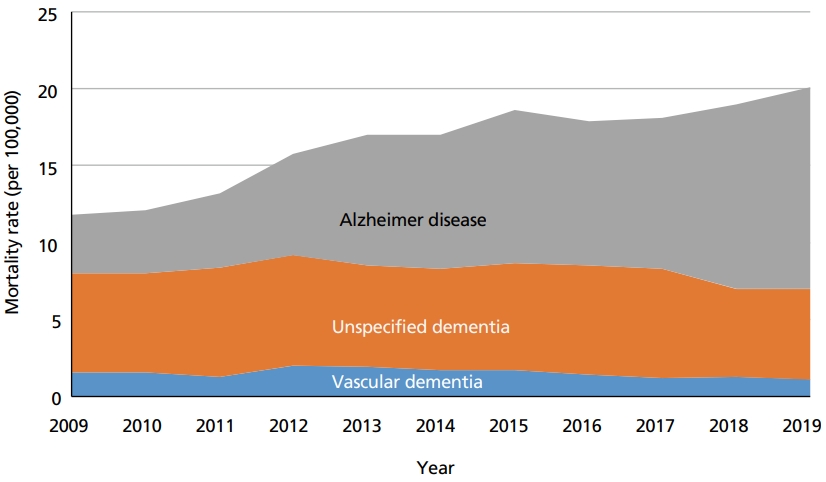
Trends in mortality rates due to dementia according to specific causes from 2009 to 2019 in Korea.
Discussion
1. Interpretation
1) Number of deaths, crude death rate, and life expectancy
The decline in deaths in 2019 from 2018 is a unique phenomenon that has not been observed since 2013 (Figure 1, Suppl. 1, 2). This is due to the underlying effect of increased deaths in 2018. In 2018, when the number of heat waves and cold days was the highest in the decade since 2008, many people were affected with heat- and cold-related illnesses. In 2018, the number of excess deaths from heat waves was 804, the highest number in the available estimates since 2010, but it decreased to 187 in 2019 [9]. Deaths from coldrelated diseases were 170 in 2018 and declined to 140 in 2019. The death rate from heart disease, which can be affected by climate change, decreased from 62.4 in 2018 to 60.2 in 2019.
The increased proportion of deaths among those ≥80 years in 2018 is due to an increase in the older population. However, the death rate for the population aged ≥80 years decreased from 2018 to 2019, reflecting longer life expectancy (Suppl. 3). Therefore, the crude death rate was 7.6 (-1.3%) per 100,000 lower in 2019 than in 2018 [3]. Similarly, newborn life expectancy increased in 2019 compared with 2018. There was no difference in the ranking of causes of death among men compared with 2018, but among women, it was notable that Alzheimer disease increased from seventh place in 2018 to fifth place in 2019 (Figures 2 and 3). This increase in ranking may be due to an increase in the older female population.
2) Malignant neoplasms
There was no difference in the ranking of cancer deaths by affected organs in 2018 (Figure 4, Suppl. 7). The highest mortality rates were found for breast cancer among those in their 30s, for liver cancer among those in their 40s and 50s, and lung cancer among those in their 60s and older (Suppl. 8). For lung cancer deaths, it remains difficult to see the impact of free screening offered by the National Health Insurance Service, as the participation rate for screening, including chest radiography-ray, was 68.2% in 2019. The active use of low-density computed tomography for lung cancer screening in high-risk individuals aged 55–74 years who have smoked 30 pack-years or more will enable early diagnosis of lung cancer and early treatment [10].
Breast cancer was the leading cause of death in women in their 30s. The crude mortality rate increased from 3.8 a decade ago to 5.1 per 100,000. Although many risk factors are known, including family history, obesity, and repeated exposure to sex hormones, they are difficult to control [11]. Breast cancer should be detected and treated early by increasing the rate of breast examination to facilitate early detection. Since April 2021, insurance benefits have been applied to breast ultrasound tests when breast and axillary diseases are suspected (once) and in cases involving the progression of breast diseases such as breast cancer. This measure is expected to reduce mortality rates if treatment is provided after early detection.
Deaths by stomach and liver cancer are related to early detection. Thus, if a diagnosis can be made quickly, early treatment can reduce mortality. Many cases of breast cancers can be detected and treated early if nationwide biennial screening mammography was done in asymptomatic women aged 40 to 69 years [12]. Colon cancers are also early detected if annual or biennial FIT for screening for colorectal cancer in asymptomatic adults, beginning at 45 years of age and continuing until 80 years [13]. A colonoscopy should be performed whenever the fecal occult blood test result is positive.
3) Reduced mortality rate due to circulatory system diseases
The mortality rate due to diseases of the circulatory system has decreased. The decrease in heart disease and hypertensive disease were influenced by the underlying effects of the cold wave in 2018; thus, mortality due to pneumonia and heart disease, which are influenced by seasonal factors decreased when compared to 2018.
4) Continued growth of Alzheimer disease as the seventh leading cause of death
Due to the increase in the aging population, the number of deaths from Alzheimer disease has increased. Death number due to dementia in aged people may continue to increase (Figure 8, Suppl. 15). Therefore, it is necessary to determine whether this phenomenon will continue.
5) Continued increase in intentional self-harm
Mortality from intentional self-harm increases among persons in their teens, 20s, and 60s (Figures 6 and 7, Suppl. 13). Notably, women in their 20s had a higher rate of increase than the other age groups (Suppl. 12, 13). Although efforts have been made at the government level to reduce the mortality rate from intentional selfharm, they have not been very effective. Because death from intentional self-harm appears to be closely related to severe mental illness or economic level, the cause should be determined among women of this age.
Korea ranks first among the 38 OECD countries, with 24.6 deaths per 100,000 from intentional selfharm in 2019. In early 2018, the National Action Plan for Preventing Suicide was announced by the Ministry of Health and Welfare and related ministries [14]. National-level interventions are being strengthened, and many local governments are operating mental health welfare centers. It is hoped that mortality rates can be reduced immediately by implementing a social psychiatric approach: Treatment of severe mental illness or alcohol dependence and intentional self-harm attempts, social support for economically vulnerable people, management of suicide tools such as charcoal and pesticides, and control of suicide reports [15].
6) Reduced alcohol-induced mortality
The alcohol-related mortality rate decreased to 9.1 per 100,000 from 9.6 in 2018. The sex ratio was 6.3 and was not different from that in 2018 (i.e., consistently showed a higher rate in males) (Suppl. 14).
Limitations: This study has no relevant limitations as it presents statistics for the entire population of the Republic of Korea.
Suggestion: It is necessary to analyze the data by disease category to obtain more accurate information. The characteristics of death caused by breast cancer should be studied in more detail.
Generalizability: This study presents data analyzed from the Republic of Korea. However, these results may reflect the country’s rapid change from low-income to high-income. The results may help predict trends in causes of death in other countries where eating habits have rapidly westernized, and the over-70 age group has grown rapidly.
Conclusion: Cause of death statistics provide an empirical background for government health policies. In Korea, the ranking of causes of death has changed rapidly in recent years. Alzheimer disease has become a common cause of death in 2019, up from being in the top 10 causes of death in 2018. Significantly, the mortality rate of dementia was 2.3 times higher in women than in men. Korean society should introduce stricter guidelines for the diagnosis and rehabilitation of dementia. Measures should also be taken against intentional self-harm.
Notes
Conflict of Interest
No potential conflict of interest relevant to this article was reported.
Data Availability
A data file is available from Harvard Dataverse: https://doi.org/10.7910/DVN/XBYJDN
Data Set 1. Descriptive data of causes of death in 2019 of Korean people published by Statistics Korea
Supplementary Materials
Supplementary materials are available from Harvard Dataverse: https://doi.org/10.7910/DVN/XBYJDN
Number of deaths and crude death rate from 1983 to 2019 in Korea
Number of deaths by sex from 2009 to 2019 in Korea
Mortality rate according to age and sex in 2009, 2018, and 2019 (per 100,000) in Korea
Trends in causes of death and their proportions in 2009, 2018, and 2019 (per 100,000) in Korea
Mortality rates and their proportions by cause of death and age in 2019, Korea (per 100,000) in Korea
Trends in mortality rates due to malignant neoplasms according to target organs in 2009, 2018, and 2019 in Korea (per 100,000 population, %)
Trends in mortality rates due to malignant neoplasms according to sex in 2009, 2018, and 2019 in Korea (per 100,000 population, %)
Trends in mortality rates due to malignant neoplasms according to age in 2009, 2018, and 2019 in Korea (per 100,000 population, %)
Trends in mortality rates due to diseases of the circulatory system according to sex in 2009, 2018, and 2019 in Korea (per 100,000 population, %)
Trends in mortality rates due to diseases of the circulatory system according to age in 2009, 2018, and 2019 in Korea (per 100,000 population, %)
Trends in mortality rates due to external causes of death according to sex in 2009, 2018, and 2019 in Korea (per 100,000 population, %)
Trends in mortality rates due to external causes of death according to age in 2009, 2018, and 2019 in Korea (per 100,000 population, %)
Trends in mortality rates due to intentional self-harm according to sex and age in 2009, 2018, and 2019 in Korea (per 100,000 population, %)
Trends in mortality rates due to alcohol-related diseases according to sex in 2009, 2018, and 2019 in Korea (per 100,000 population, %)
Trends in mortality rates due to dementia according to sex in 2009, 2018, and 2019 in Korea (per 100,000 population, %)
References
Peer Reviewers’ Commentary
이 논문은 우리나라 통계청의 2019년 사망원인 통계 자료를 분석하여 사망률과 기대수명, 사인 순위를 제시하고 2018년 사망률과 비교하여 설명하고 있다. 고령화가 아주 빠르게 진행되고 이에 따른 사망의 원인이 성별 및 연령별로 다른 변화를 보이는 세계적인 추세 속에서, 우리나라의 경우 알츠하이머병이 10대 사망원인으로 등극한 것은 큰 변화일 수 있다. 또한 여성이 남성에 비교하여 치매로 인한 사망률이 높다는 결과를 보여준 것은 우리나라 의료 정책의 방향을 정하는 데 기본적인 중요한 정보를 제공하고 있다. 이 논문은 우리나라 사망원인에 대한 연속성의 자료와 결과의 경향성을 보여줌으로써 질병 예방과 관리를 위한 학문적 및 정책적 측면에서 기본적 정보를 제공할 것이며, 사망원인에 대한 깊이 있는 연구를 추진하는 데에도 많은 도움을 줄 것으로 판단된다.
[정리: 편집위원회]