


Introduction
In the cause-of-death statistics from 2016 in the Republic of Korea, injury deaths, including those caused by transport accidents, falls, unintentional drowning, intentional self-harm, and homicide, comprised 2.2%, 25.1%, and 55.0% of deaths in the age groups of 0, 1-9, and 10-19 years, in which the number of deaths was 1,707, 1,043, and 1,462, respectively [1]. In Korea, an analysis was conducted of unintentional injuries in people aged less than 20 years through data of the National Emergency Department Information System of Korea from January 2010 to December 2011, which reported that “Most (94.1%) injuries were unintentional while 5.9% were intentional. The mortality rate was 5.4 per 100,000. The mortality rate of pediatric unintentional injuries was 0.1% including the prehospital deaths and emergency department deaths” [2]. In another study, 17,105 injured children younger than 15 years of age who visited the emergency room of a single hospital in Korea from June 2011 to May 2013 were analyzed. Among severely-injured patients, the most common place of injury was roads (50.00%, P=0.009), and the most common mechanism of injury was traffic accidents (50.00%), followed by falls (31.82%) (P=0.011) [3]. In 2004, the injury death rate in children younger than 15 years of age was 10.8 per 100,0000 (639 boys and 393 girls). The most frequent cause was transport accidents (38.0%), followed by drowning (21.2%), falling (13.7%), suffocation (13.3%), burning (6.3%), and poisoning (3.2%). The most common cause was suffocation in infants (less than 1-year-old), falling in 2-year-olds, drowning in 3-year-olds, and transport accidents in 1- and 4-year-olds [4]. Beyond the above data, few studies have investigated child injury deaths in Korea. Most child injury deaths are preventable by taking appropriate measures and implementing suitable safety systems in the environment. For example, to prevent accidents at home, the dissemination of a manual or booklet entitled the “New parent information kit” is recommended. To prevent bicycle accidents, the need to wear a helmet and to use a coaster brakes should be emphasized, and parents and children should be educated on this topic [5].
Child injury is one of the most important public health issues in the world [6]. Unintentional accidents are the most common cause of child deaths worldwide [7]. Although there was a decrease in child injury deaths after 2003, when the Korean Government initiated a nation-wide child safety system, we should strive further to reduce child injury deaths to provide a safer life for children.
Basic data on child injury deaths are mandatory in order to develop and implement prevention preventable measures or policies. Therefore, we analyzed child injury deaths using micro-data from the death statistics of Korea from 2006 to 2016, which were made available by Statistics Korea.
Methods
Ethics statement: No institutional approval or informed consent was required because this was an analysis of publicly available data that were produced by Statistics Korea according to the Bioethics and Safety Act.
Study design: This study was a public database-based analysis.
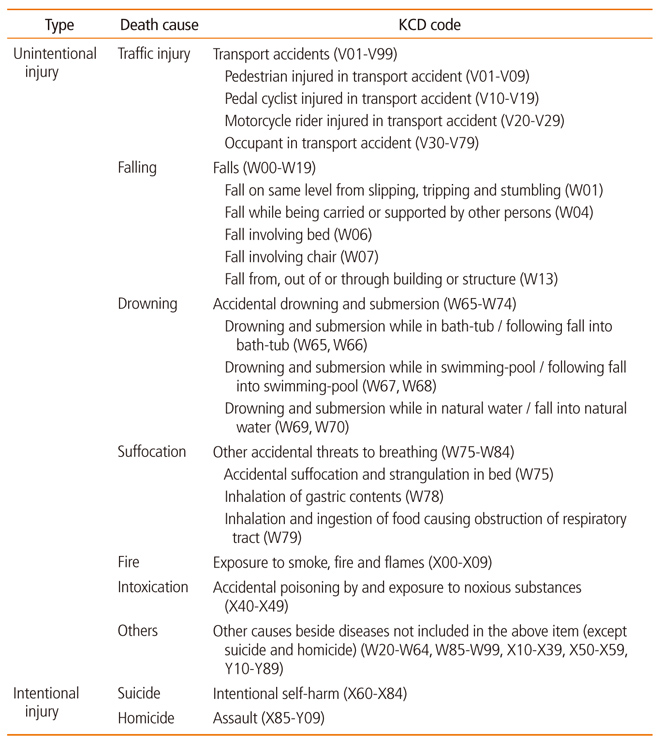
Data source and analysis: The data in this article were drawn from micro-data of the death certificates issued in 2016 for Korean people who resided in Korea, available from: https://mdis.kostat.go.kr. In order to compare the data internationally, the causes of death were classified according to the International Statistical Classification of Diseases and Related Health Problems, 10th revision, as recommended by the World Health Organization, as well as the Korean Standard Classification of Diseases and Causes of Death (KCD-7), which has been modified to fit circumstances in Korea, as described in a previous report [1]. Children were defined as the age group from 0 to 14 years old. Children were divided into age groups of 0 (infants), 1-4, 5-9, and 10-14 years for comparison with data from other Organization for Economic Co-operation and Development (OECD) countries. Deaths caused by accident were classified into intentional and unintentional accidents (Table 1). Intentional accidents comprised homicide and intentional self-harm. Unintentional accidents comprised transport accidents, falling, drowning, suffocation, fire, poisoning, and other causes of accidents besides diseases.
The death rates of OECD countries were obtained from the World Health Organization Mortality Database, available from: https://www.who.int. Only data from the 32 OECD member countries were compared.
Type and place of accident were collected according to the KCD-7 (Table 1). Specific causes were classified as follows: transport accidents (V01-V999), falling (W00-W19), drowning (W65-74), suffocation (W75-84), fire (X00-09), poison (X40-49), other accidents (W20-W64, W85-99, X10-X39, X50-X59, Y10-Y89), intentional self-harm (X60-X84), and homicide (X85-Y09). Death certificates with no concrete description of the type or place of accident or with a statement that the cause of death had not been identified were treated as unspecified.
Statistical analysis: Descriptive statistics was used.
Results
1. Trends in child injury deaths
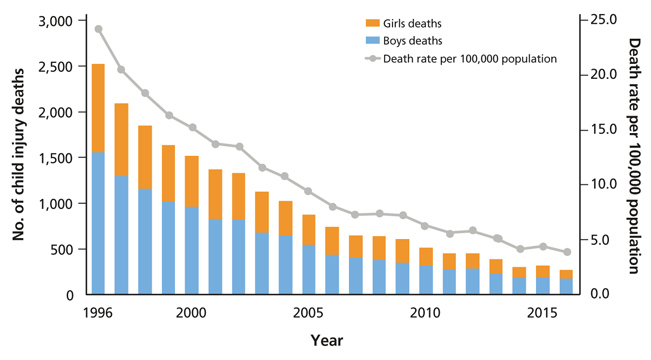
The child injury death rate was 3.9 per 100,000 population, which was half of that in 2006 (8.1) (Suppl. 1). In 2016, the total number of child deaths was 1,830, of which 270 (14.8%) were child injury deaths, which was one-third of the number observed in 2006 (738). The average number of child injury deaths per day was 0.7 in 2016, whereas it was 2 in 2006. The death rate of boys (4.9) was greater than that of girls (2.8) in 2016. In 2016, the rate of boys was 9.1 and that of girls was 6.9 (Figure 1, Suppl. 2).
2. Types of child injury deaths (intentional vs. unintentional)
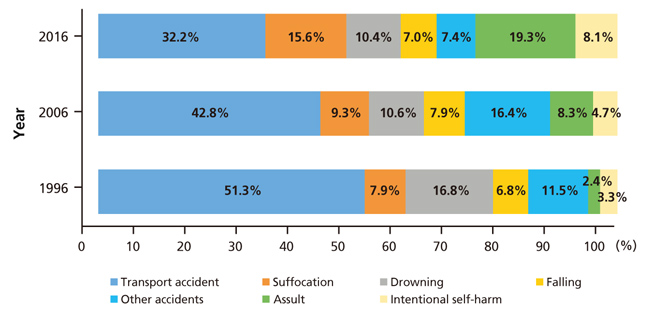
Unintentional injury deaths comprised 72.6% of all child injury deaths in 2016, while intentional injury deaths comprised 27.4%. The corresponding percentages were 87.0% and 13.0%, respectively, in 2006. Of the unintentional injury deaths, transport accidents (32.3%) were the top-ranking cause. Of the intentional deaths, homicide (19.3%) was the most common cause. In contrast to the data from 2006, the composition of following causes decreased: transport accidents (−10.6%p), fire (−3.8%p), falling (−0.8%p), poisoning (−0.3%p), and drowning (−0.2%p). In contrast, the following causes increased: suffocation (+6.2%p), homicide (+11.0%p) and intentional self-harm (+3.4%p) (Figure 2). The child injury death rate by unintentional accidents was 2.8 per 100,000 population; while that by intentional accidents was 1.1. In comparison to 10 years ago, the unintentional death rate decreased by 4.2 (from 7.0) per 100,000 population, while that by intentional deaths did not change. Transport accidents had the highest death rate among the causes of unintentional death (1.2) (Figure 3, Suppl. 3). The death rate among boys was greater than that of girls by 3.8 times for fire, 3.4 times for drowning, and 2.6 times for transport accidents (Suppl. 4).
3. Causes of child injury death by unintentional accidents for 3 years (2014-2016)
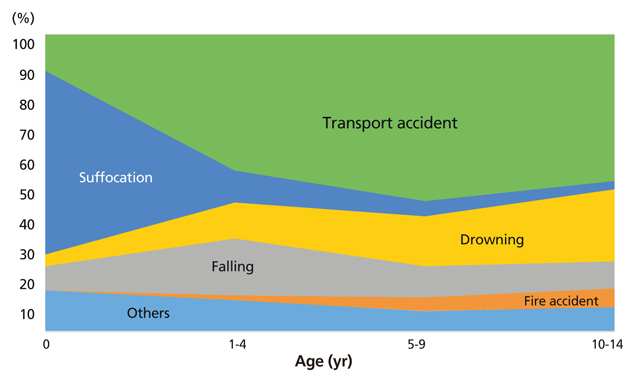
From 2014 to 2016, the ranking of the causes of death by unintentional accidents were as follows: transport accidents (42.5%), suffocation (17.9%), drowning (14.5%), falling (12.3%), and fire (3.1%). For these 3 years, the number of child injury deaths by unintentional accidents was 636 and the rate was 3.0 per 100,000 population. The death rate was most common in the first year of life (10.5), after which the death rate decreased as age increased. The rate was 1.9 in children aged 10-14 years (Suppl. 3). The top-ranking cause of child injury deaths was suffocation in the first year of life, and transport accidents in 1- to 14-year-olds. The second ranking was transport accidents in the first year of life, falling in 1- to 4-year-olds, and drowning in 5- to 14-year-olds (Figure 2).
4. Characteristics associated with each type of death (2014-2016)
1) Transport accidents
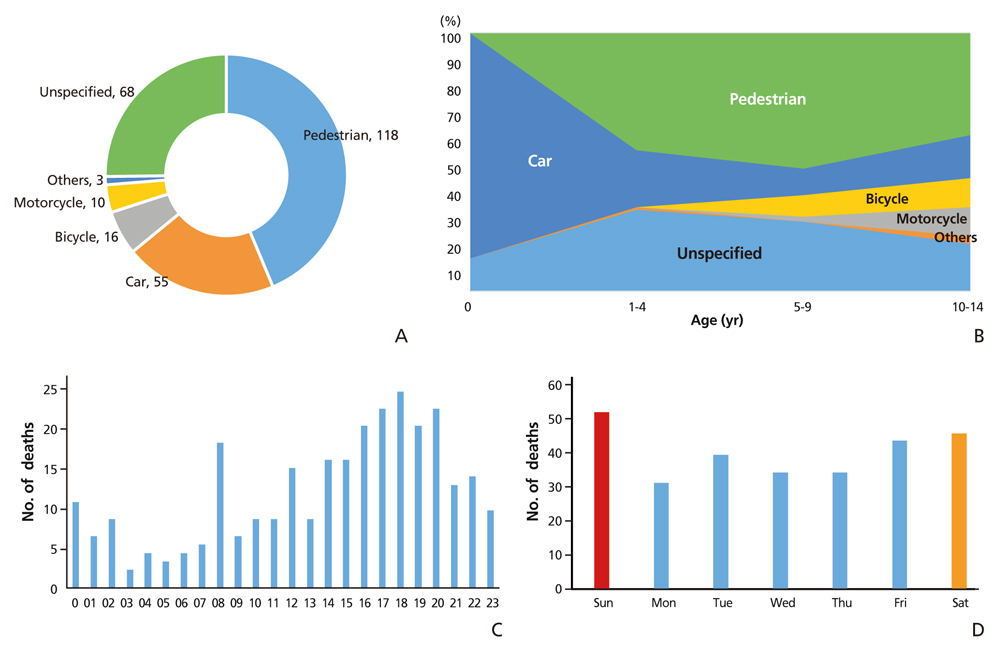
Pedestrian accidents accounted for 43.7% of child deaths in transport accidents. In 2014-2016, the total number of deaths of children by transport accidents was 270, and the death rate by transport accidents was 1.3 per 100,000. The death rate of boys (1.6) was higher than that of girls (0.9). The death rate by transport accidents (1.5) was the highest in the age group of 1- to 4-year-olds (Suppl. 5). The death rate by transport accidents decreased the most in the age group of 1-4 years, from 5.8 in 2004-2006 to 1.5 in 2014-2016 (Suppl. 6). The causes of death among children in the category of transport accidents were as follows: pedestrians (43.7%), vehicle occupants (20.4%), bicycle occupants (5.9%), and motorcycle occupants (3.7%). Overall, 50.4% of all child injury deaths caused by transport accidents occurred between Friday and Sunday. Transport accidents occurred most frequently at 4-8 p.m. (38.1%) and 8 a.m. (6.3%) (Figure 4).
2) Suffocation accidents
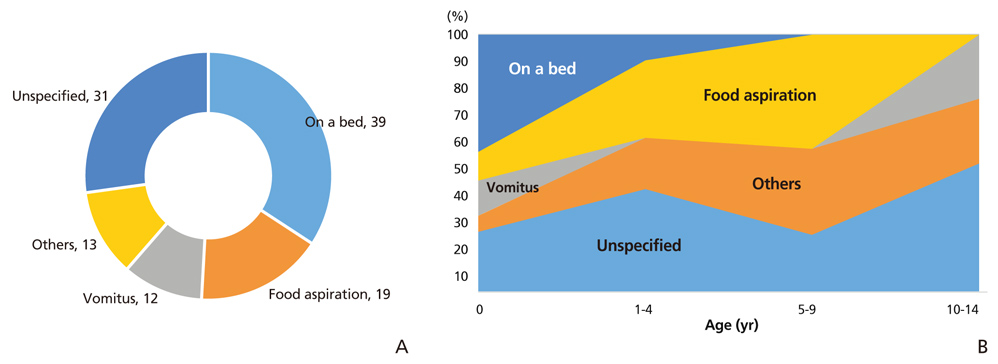
Choking in bed comprised 34.2% of child deaths by suffocation. In 2014-2016, the number of suffocation deaths was 114, and the death rate by suffocation was 0.5 per 100,000 population. The death rate by suffocation was highest in the first year of life (6.5). In 2014-2016, the most common type of child suffocation was choking in bed (34.2%), followed by food inhalation (16.7%) and inhalation of gastric contents (10.5%) (Suppl. 7).
Choking in bed occurred by suffocation from a pillow, the mother's body, or a bedspread. Inhalation of food causes airway pressure or obstruction due to food (including bones or seeds). Inhalation of stomach contents also causes airway pressure or obstruction due to vomitus (Figure 5).
3) Drowning
The child death rate due to drowning decreased from 1.5 in 2004-2006 (1.5) to 0.4 in 2014-2016 (Suppl. 8). Drowning in natural water, such as a stream or river, comprised 30.4% of child deaths by drowning, while drowning in bathtubs comprised 7.6% of such deaths and drowning in swimming pools, 5.4%. In 2014-2016, the number of deaths from drowning was 78, and the death rate from drowning was 0.4 per 100,000 population. The mortality rate of boys (0.6) was 2.8 times higher than that of girls (0.2). The death rate by drowning accidents in the 0- to 9-year-old age group was 0.4, while that of the 10- to 14-year-old age group was the highest (0.5) (Suppl. 9). Deaths in children aged under 5 years old were mainly caused by bathtubs, while in older children, drowning in natural water became the most common cause (Figure 6).
4) Falling
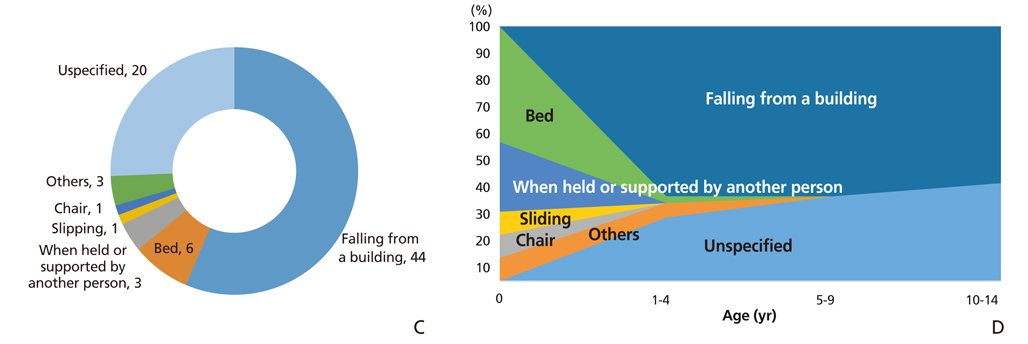
Falling from a building comprised 56.4% of child deaths from falling, while falling from bed comprised 7.7% of deaths and falling when held or supported by another person, 3.84%. In 2014-2016, the number of deaths from falling was 213, and the death rate from falling was 0.8 per 100,000 population (Suppl. 10). The death rate by falling accidents in the 0- to 9-year-old age group was 0.6, while it was 0.2 in children aged 10-14 years. Falling deaths in children aged under 5 years old were caused mainly by falls from buildings, from bed, and when held or supported by another person. In older children, such deaths were mainly caused by falls from buildings (Figure 7, Suppl. 11). The child death rate caused by falling decreased from 0.8 in 2004-2006 to 0.4 in 2014-2016 (Suppl. 10).
5. Comparison with data from other OECD countries
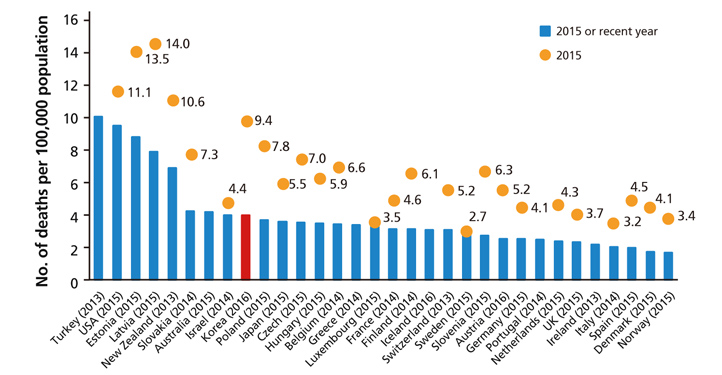
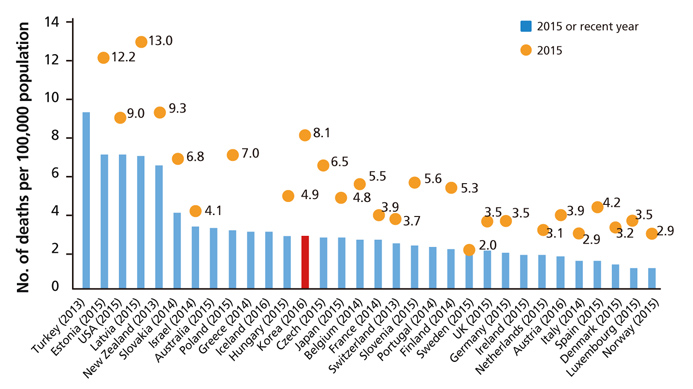
In 2015 or the most recent available year, the average child injury death rate in the 32 OECD countries was 3.7, while that of Korea was 3.9, which was the ninth highest rate. In 2005, the average child injury death rate of the 26 OECD countries was 6.3, while that of Korea was 9.4, which was the fifth highest rate (Figure 8, Suppl. 12). The average unintentional child injury death rate of the 32 OECD countries in 2015 (or the most recent year) was 3.1 per 100,000 population; while that of Korea was 2.8, which was the 12th highest rate. In 2005, the average rate in the 26 OECD countries was 5.5, while that of Korea was 8.1, which was the fifth highest rate (Figure 9, Suppl. 13).
Discussion
3. Efforts to improve the present situation
Korea has been regularly making efforts to improve the laws and systems related to children's safety since the government declared the first Year of Child Safety in 2003. The Korean government has upgraded safety measures for children 4 times and improved the system evaluation and tasks. In order to prevent transport accidents, Korea needs to execute the following policies more strictly: improving the school bus system; strengthening the use of traffic signals in school zones; more stringently applying the policy of mandatory seat belt use by all passengers in a car and helmet use when riding a bicycle or autobicycle [9]; implementing safety training for drowning, mandatory swimming training starting in elementary school, and education for fall prevention; and strengthening initiatives related to public relations, inspection of safety facilities, safety glass-reinforced windows, and locks.
More active measures need to be taken to prevent deaths caused by transport accidents, falling, and suffocation because the infant injury death rate in Korea was higher than the average rate of OECD countries although injury death rate of 1- to 14-year-olds was not higher (Suppl. 12). In order to develop and implement interventions to prevent child injury death, we should define the problem, identify causes, develop and test interventions, and go through the process of nationwide adoption [6]. To prevent child injury deaths, a safety system should be constructed that accounts for children's age and sex, in a way that fits circumstances in Korea.
Peer Reviewers' Commentary
This study investigated statistics on child injury deaths in Korea from 2006 to 2016, presenting an interesting analysis of death certificate data for the Korean population, as death certificates are a representative statistical indicator in Korea. Furthermore, this paper reports noteworthy findings regarding trends in the mortality rate from injury deaths in children in the last 10 years. The most significant change in this period was the reduction in child injury deaths. Reductions in unintentional injuries, such as traffic accidents, burns, and falls, made a major contribution to this trend. It is also interesting that many traffic accidents affected pedestrians, and that many deaths occurred due to suffocation in bed. However, the rate of child injury deaths in Korea is still higher than in most other OECD countries, indicating that there is room for further improvement. This paper is considered to be a valuable resource that provides information on the health status of Korea and can serve as a useful reference material for researchers in this field.
[Editorial by Editorial Board]