Introduction to high field strength magnetic resonance imaging
Article information
J Korean Med Assoc. 2010;53(12):1055-1058
Publication date (electronic) : 2010 December 07
doi :
https://doi.org/10.5124/jkma.2010.53.12.1055
Received 2010 October 28; Accepted 2010 November 12.
Abstract
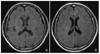
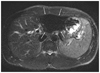
Recently 3 tesla (T) magnetic resonance imaging (MRI) has been increasingly used in the clinical field. 3T MRI has many advantages, such as a better signal-to-noise ratio, increased chemical shift, and increased susceptibility, whereas it has several disadvantages such as increased relaxation time, radiofrequency field inhomogeneity, and increased specific absorption rate. The awareness of these advantages and disadvantages of 3T MRI will lead to better outcomes in clinical and research applications.
References
1. Kim DH, Kim DH, Huh YM. Korean Socity of Magnetic Resonance in Medicine. High tesla MRI. Magnetic resonanace imaging 2008. Seoul: Iljogak; 341–354.
2. Schmitz BL, Aschoff AJ, Hoffmann MH, Grön G. Advantages and pitfalls in 3T MR brain imaging: a pictorial review. AJNR Am J Neuroradiol 2005. 262229–2237.
3. Frayne R, Goodyear BG, Dickhoff P, Lauzon ML, Sevick RJ. Magnetic resonance imaging at 3.0 Tesla: challenges and advantages in clinical neurological imaging. Invest Radiol 2003. 38385–402.
4. Bernstein MA, Huston J 3rd, Lin C, Gibbs GF, Felmlee JP. High-resolution intracranial and cervical MRA at 3.0T: technical considerations and initial experience. Magn Reson Med 2001. 46955–962.
5. Barker PB, Hearshen DO, Boska MD. Single-voxel proton MRS of the human brain at 1.5T and 3.0T. Magn Reson Med 2001. 45765–769.
Article information Continued
Copyright © 2010 Korean Medical Association