


 |
 |
| J Korean Med Assoc > Volume 53(12); 2010 > Article |
Abstract
Recently 3 tesla (T) magnetic resonance imaging (MRI) has been increasingly used in the clinical field. 3T MRI has many advantages, such as a better signal-to-noise ratio, increased chemical shift, and increased susceptibility, whereas it has several disadvantages such as increased relaxation time, radiofrequency field inhomogeneity, and increased specific absorption rate. The awareness of these advantages and disadvantages of 3T MRI will lead to better outcomes in clinical and research applications.
References
1. Kim DH, Kim DH, Huh YM. Korean Socity of Magnetic Resonance in Medicine. High tesla MRI. Magnetic resonanace imaging 2008;Seoul: Iljogak. 341-354.
2. Schmitz BL, Aschoff AJ, Hoffmann MH, Grön G. Advantages and pitfalls in 3T MR brain imaging: a pictorial review. AJNR Am J Neuroradiol 2005;26:2229-2237.
3. Frayne R, Goodyear BG, Dickhoff P, Lauzon ML, Sevick RJ. Magnetic resonance imaging at 3.0 Tesla: challenges and advantages in clinical neurological imaging. Invest Radiol 2003;38:385-402.
4. Bernstein MA, Huston J 3rd, Lin C, Gibbs GF, Felmlee JP. High-resolution intracranial and cervical MRA at 3.0T: technical considerations and initial experience. Magn Reson Med 2001;46:955-962.
5. Barker PB, Hearshen DO, Boska MD. Single-voxel proton MRS of the human brain at 1.5T and 3.0T. Magn Reson Med 2001;45:765-769.
Figure 1
Better signal-to-noise ratio at 3 tesla (T). Fluid attenuated inversion recovery image obtained at 1.5T (A) looks more coarse than the image at 3T (B) in the same patient, reflecting the better signal-to-noise ratio at 3T.
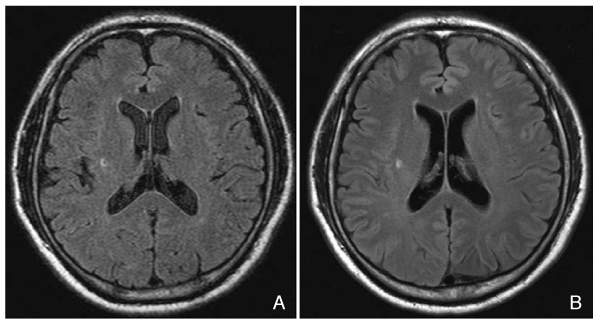
Figure 2
Better spatial resolution at 3 tesla (T). On magnified angiographic images of the right middle cerebral artery at 1.5T (A) and 3T (B) in the same patient, more detailed anatomical resolution is achieved at 3T.
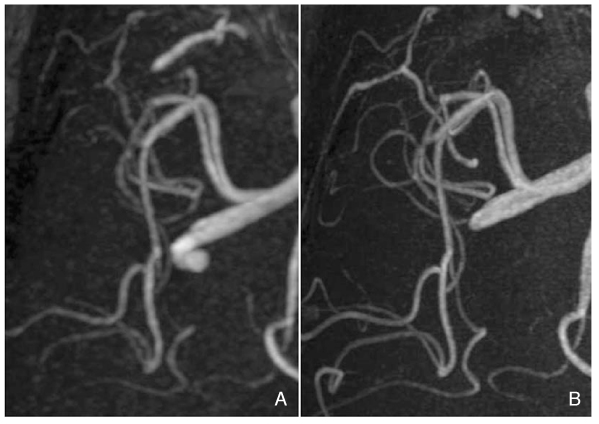
Figure 3
Increased susceptibility at 3 tesla (T). Compared with gradient-echo image obtained at 1.5T (A), the image at 3T (B) of the same patient shows more clearly defined dark dots (microbleeds) in the thalamus, and more conspicuous dark signal intensity (iron deposit) of the basal ganglia, suggesting the increased susceptibility at 3T.

- TOOLS
-
- Share :
-


-
METRICS

-
- 0 Crossref
- Scopus
- 1,452 View
- 11 Download
-

-
Related articles in
J Korean Med Assoc -
Health insurance policies for magnetic resonance imaging tests in Korea2021 March;64(3)
Clinical application of high field strength magnetic resonance imaging2010 December;53(12)
High field strength magnetic resonance imaging of cardiovascular diseases2010 December;53(12)
High field strength magnetic resonance imaging of abdominal diseases2010 December;53(12)
High field strength magnetic resonance imaging of musculoskeletal diseases2010 December;53(12)
- Editorial Office
-
37 Ichon-ro 46-gil, Yongsan-gu, Seoul
Tel: +82-2-6350-6562 Fax: +82-2-792-5208 E-mail: jkmamaster@gmail.com
Copyright © 2024 by Korean Medical Association.
